Desktop Version
Video Tutorial
Check out this video tutorial walking you through how to use our application!
Initial Screen
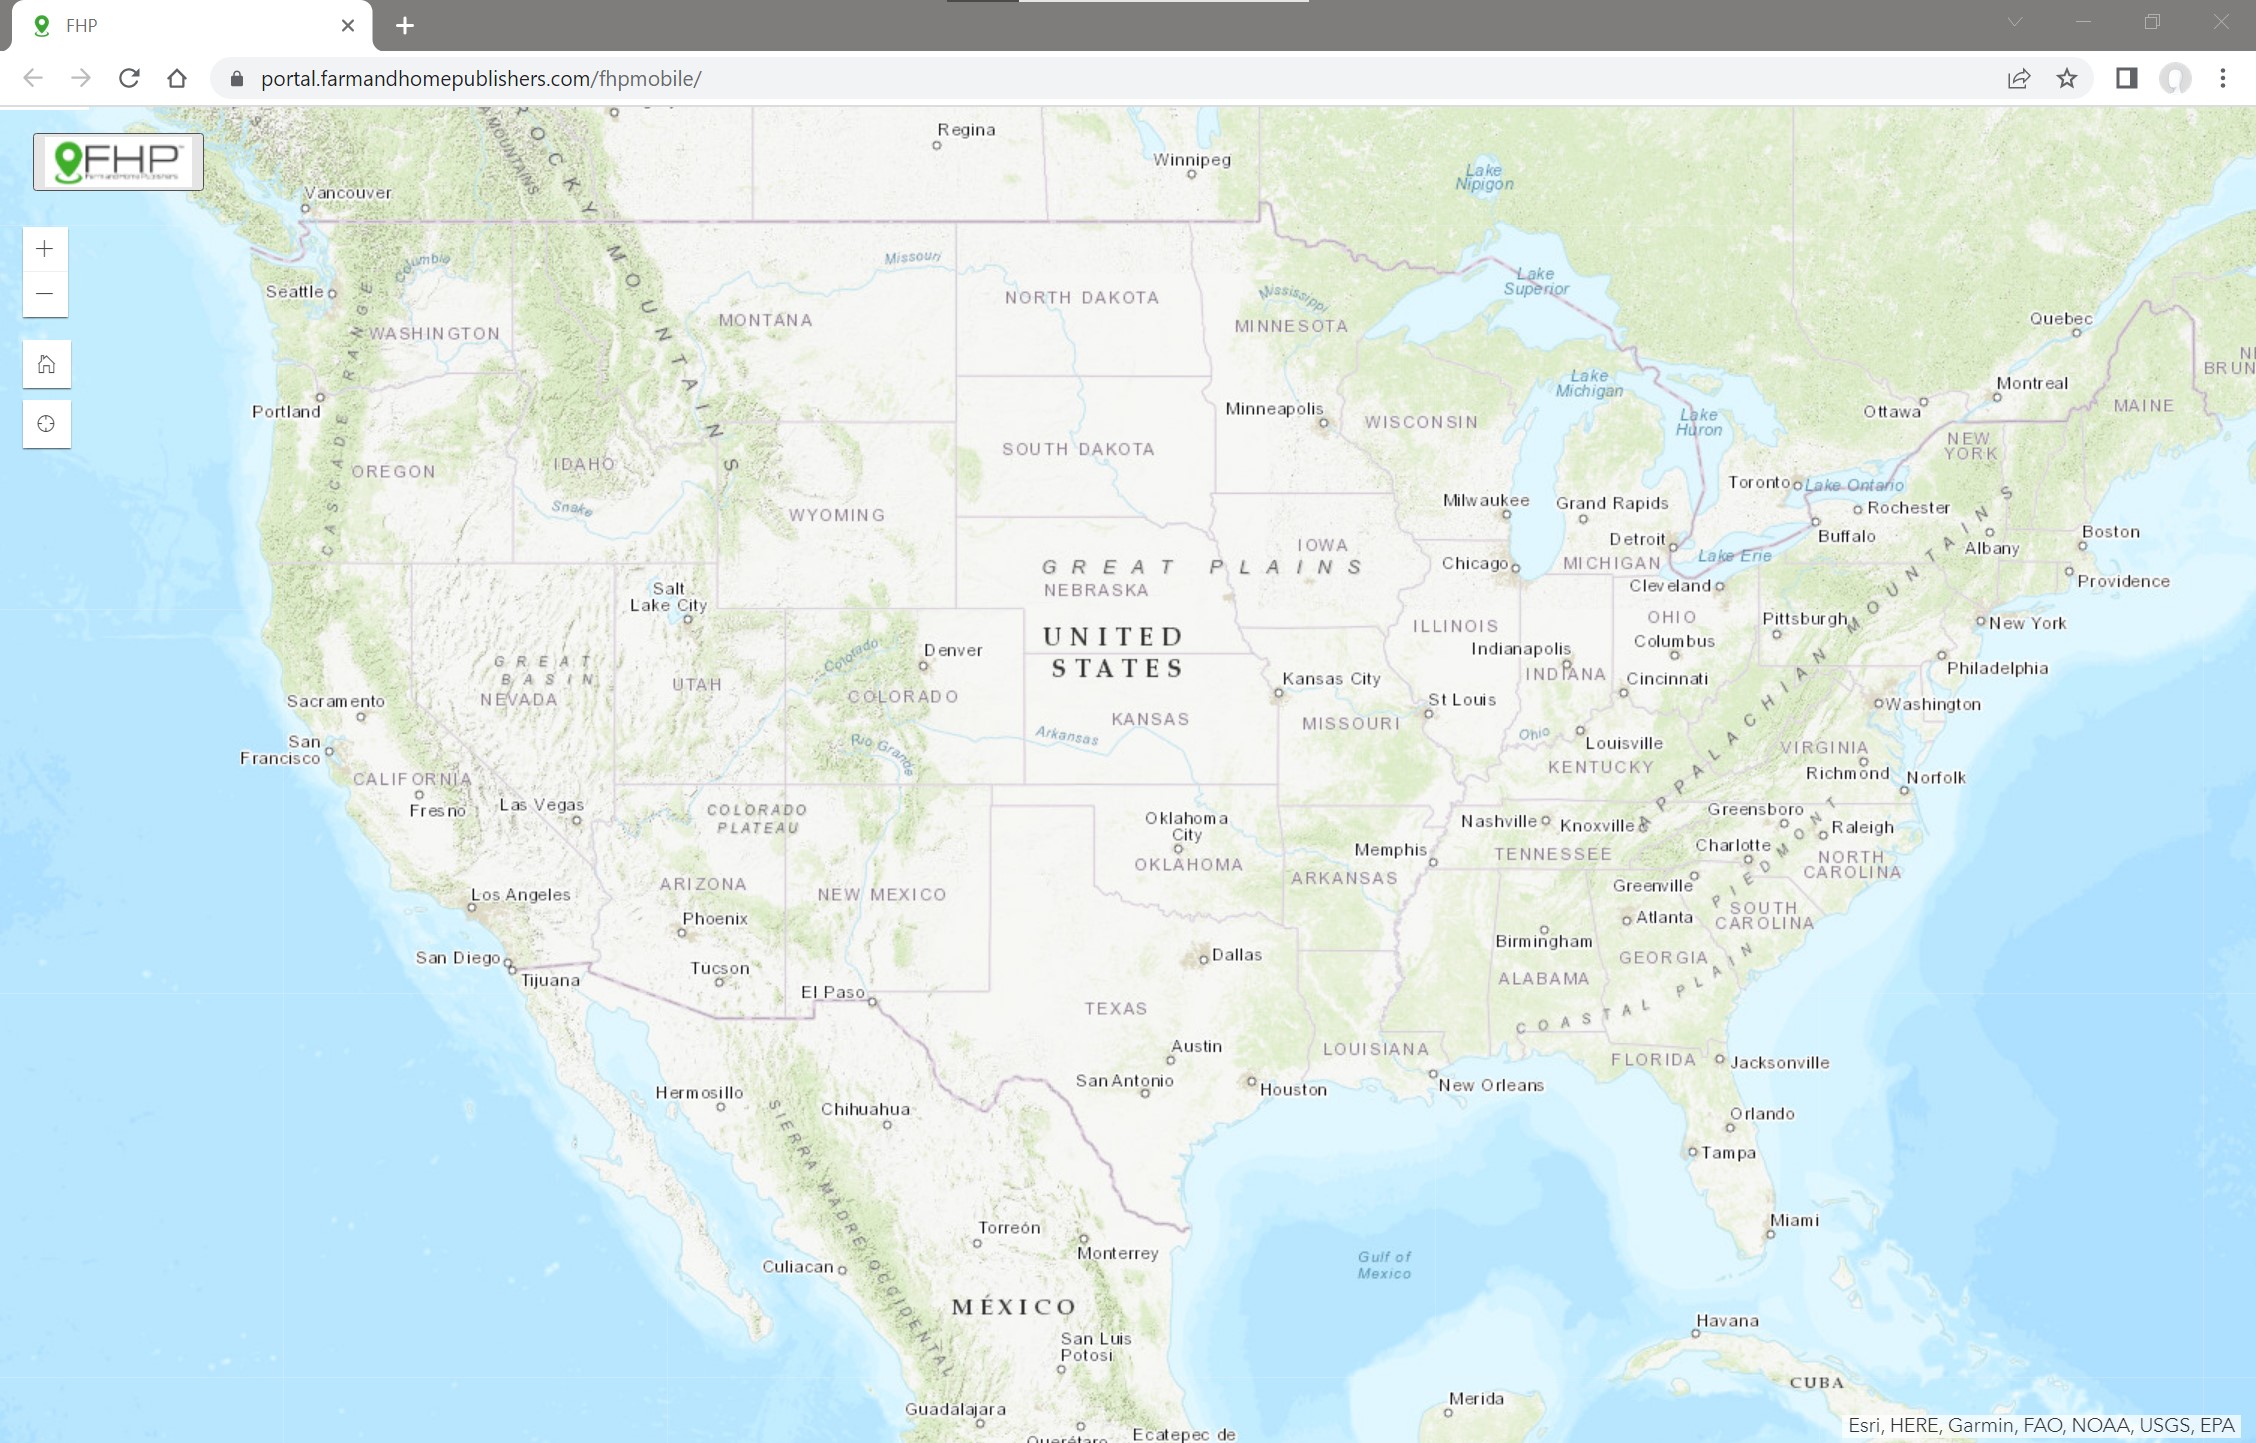
- The initial screen of the application upon launch.
Menu
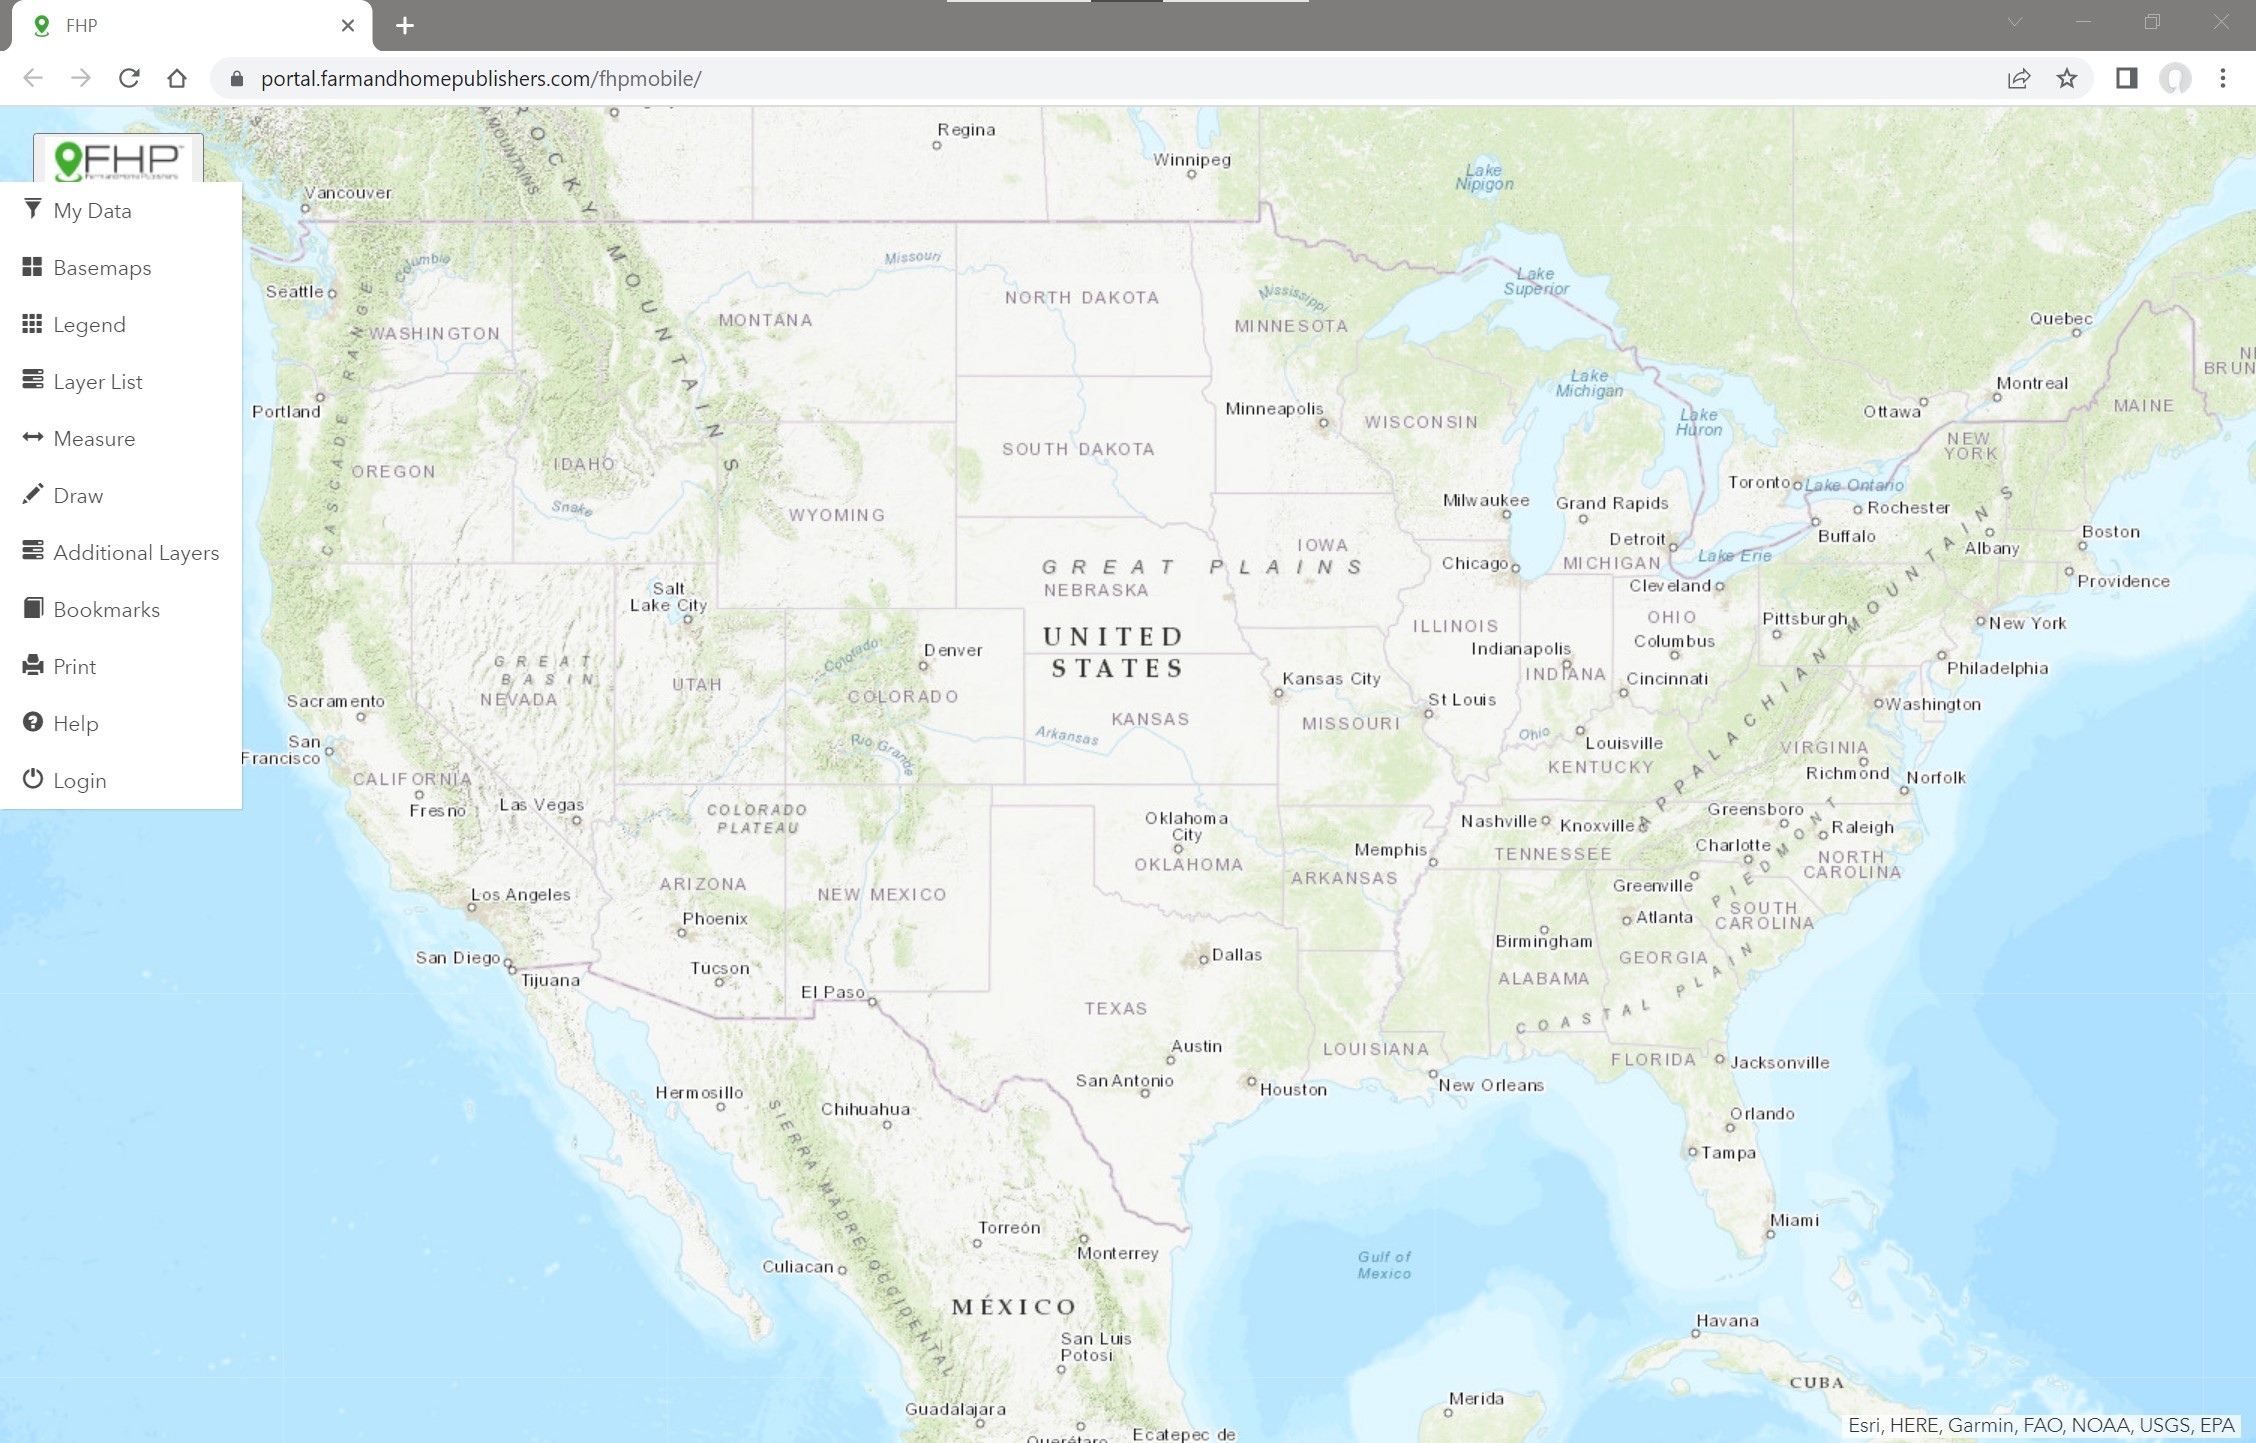
- Click on the FHP logo located in the top left corner of the screen to access the menu.
- The image above shows what the menu looks like before the user logs in.
- Click the login button to access your data.
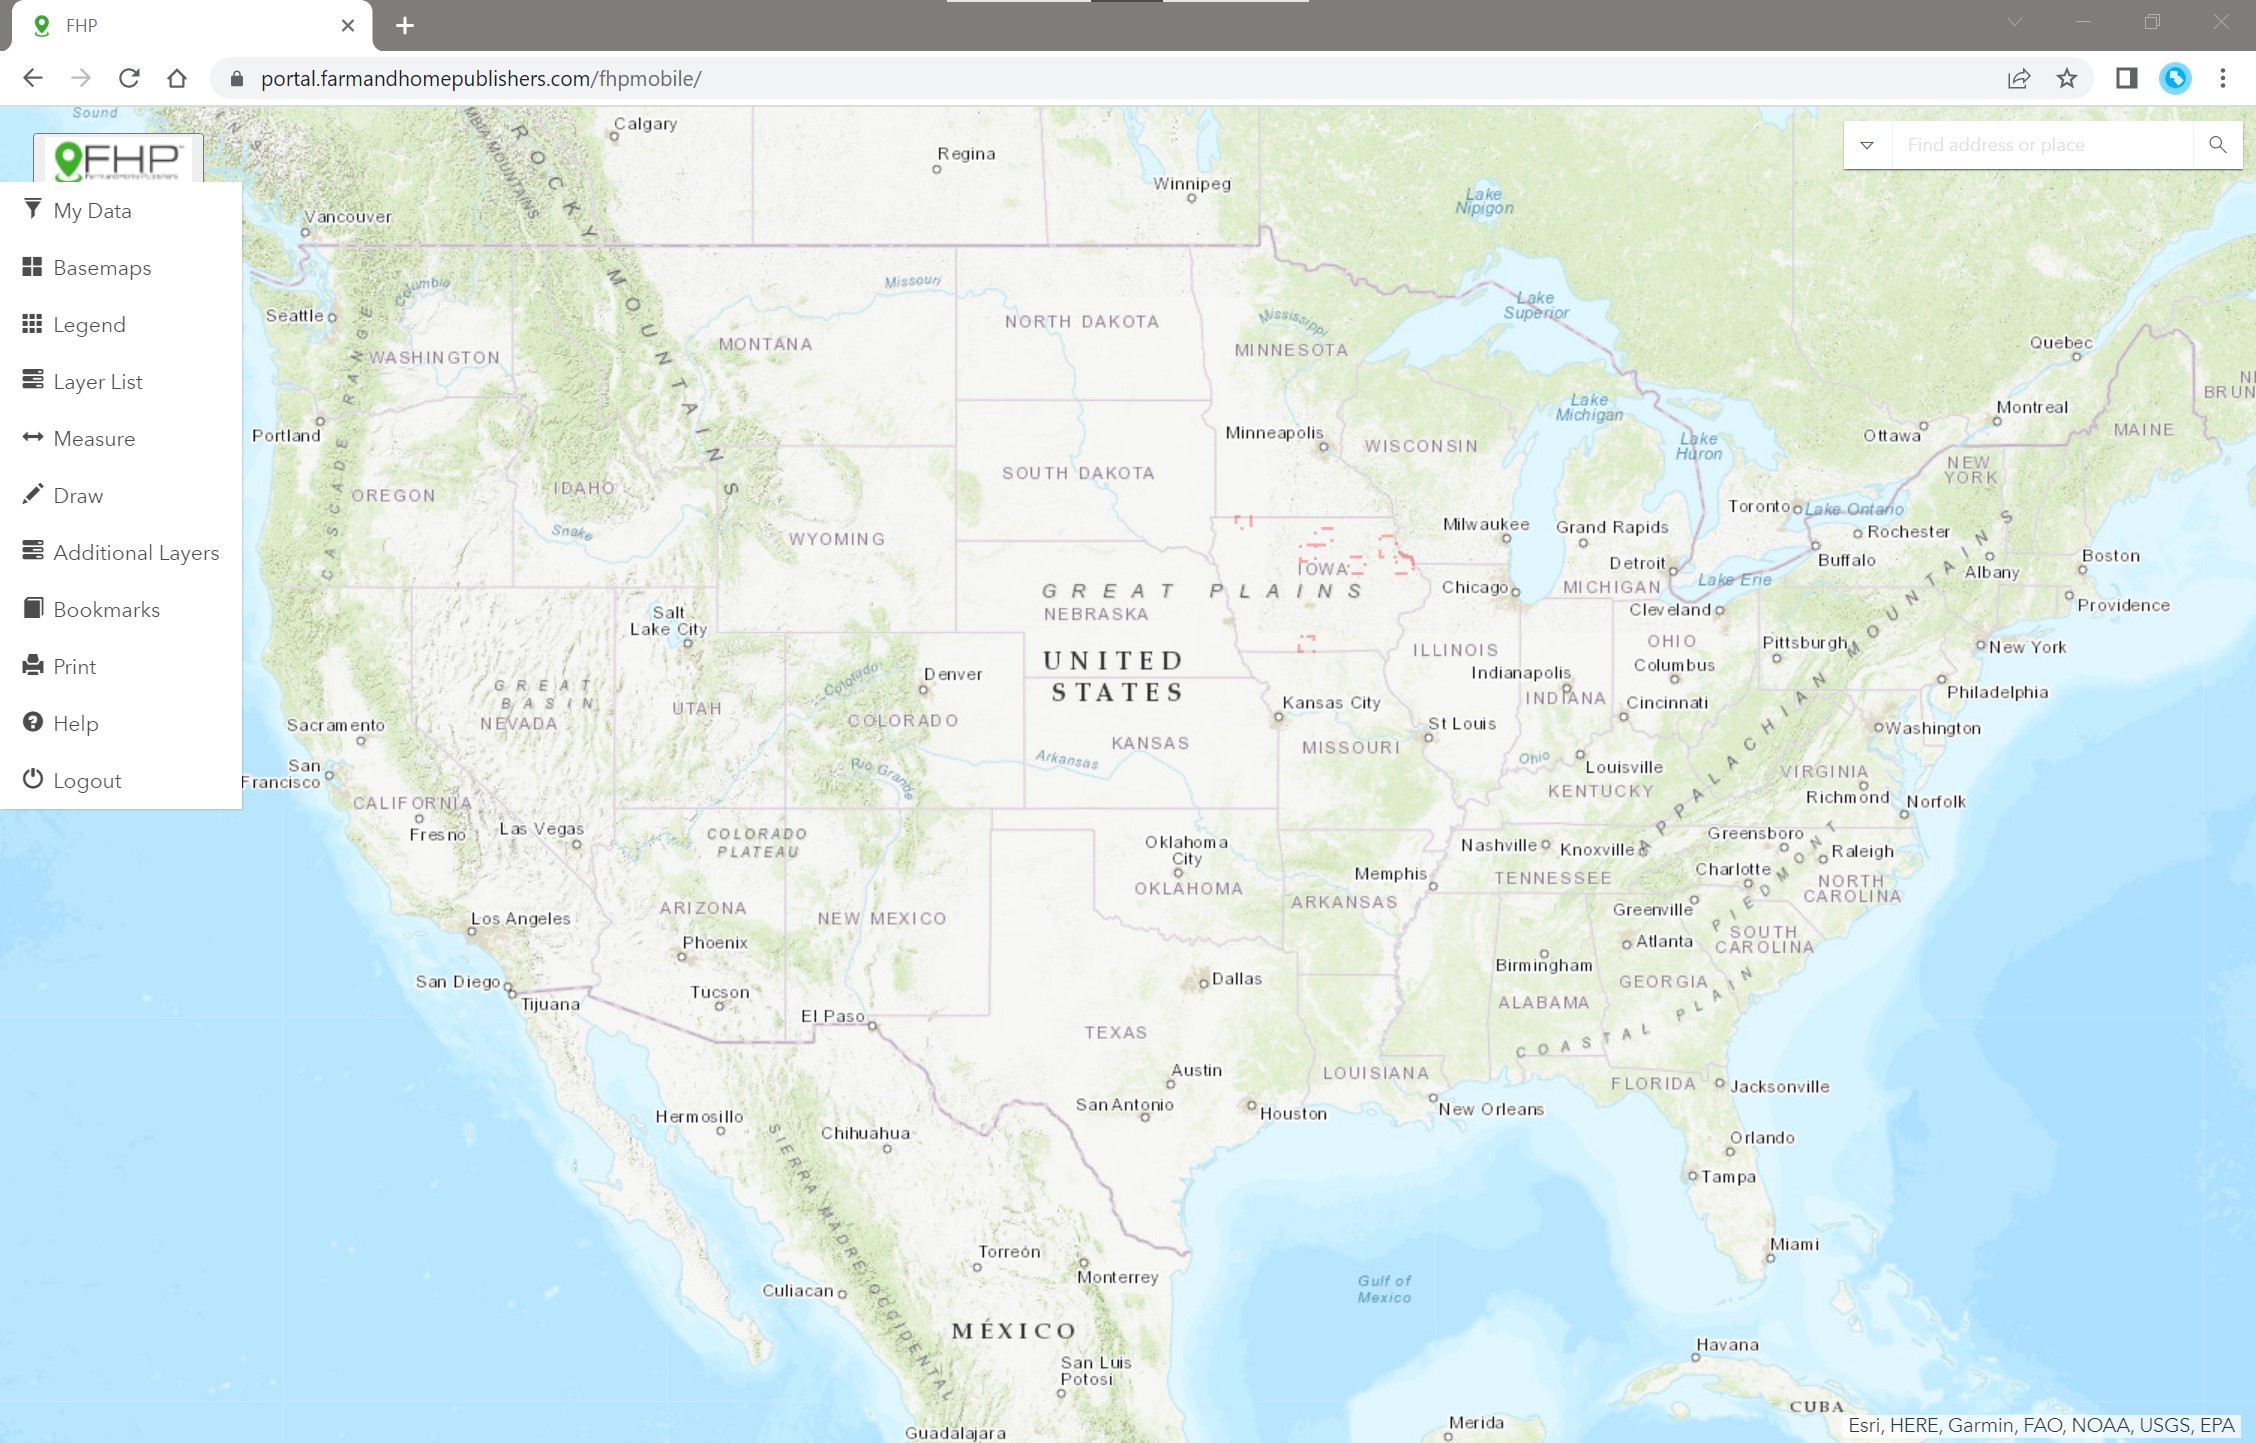
- The second image below shows the menu after logging in.
- The data that you have access to will be automatically loaded in upon login.
- If you are having issues logging in, please click the "Do not remember your password?" option to reset your password via your email.
- Conversely, if you do not have an account yet, instead click the "Sign Up" option on the login screen. Gaining access to new counties is currently in beta and should be done through contacting FHP staff.
- If you have questions or need help, contact Farm and Home Publishers via the Contact Us link on the FHP website.
My Data
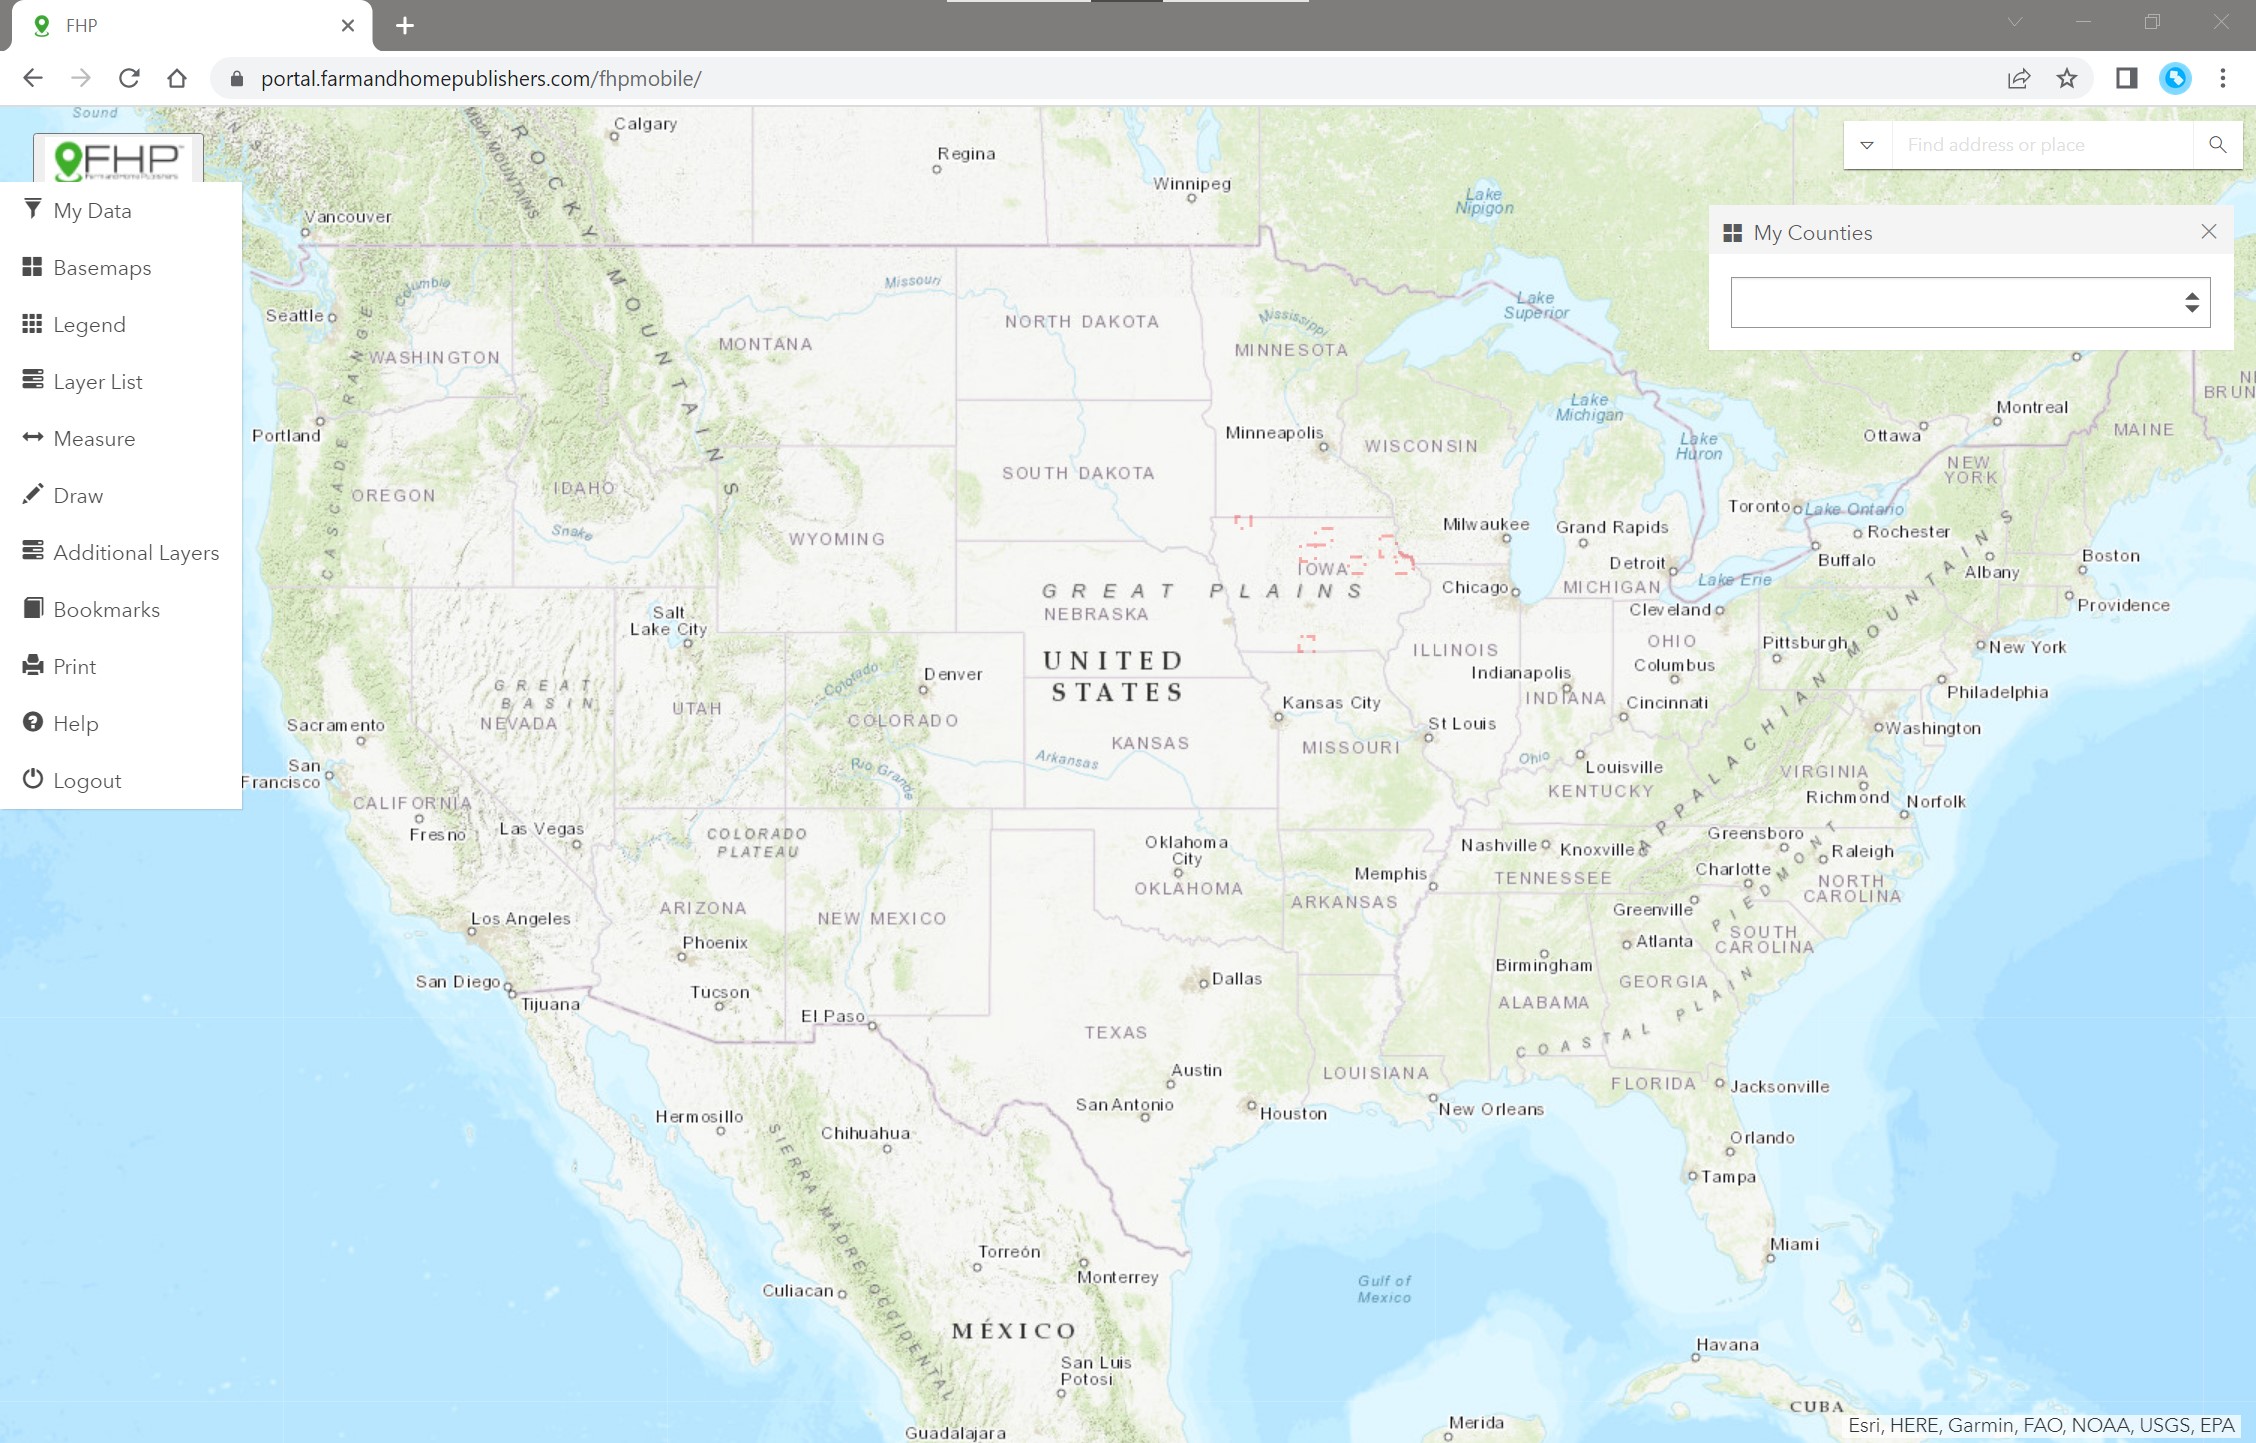
- Going through the menu, the first tool from the top is "My Data." This tool provides a list of all the counties that your user account has access to. By clicking on a county in the list, you will automatically zoom to the extent of the county. The list is sorted alphabetically by state, then county name.
Good to know:
The FHP GIS App provides valuable access to combined data sets. Of these, some of the key ones are:
- Resident information. The resident information is a geospatial data set, unique to FHP's app and web viewer. This provides detailed information about the person residing at an address, which is often not the same data as the owner. Included in the Resident data set are:
- Name
- Street Address
- Phone
- City, State, Zip Code
- XY location
- PLSS and Civil Township
- Land Owner information (Parcel Owner). The land owner information includes dozens of data points for over 3K counties possible. Included in the parcel data are:
- Owner Name
- Secondary Owner
- Mailing Address
- Acreage (Recorded)
- Acreage (Calculated)
- Land Use Type
- Year Built
- Various value data points
- Legal Description
- And more
There are several other data layers accessible in the FHP app.
Basemaps
- Click Basemaps to switch the underlying map to see multiple views, including Satellite, Street Map, Dark Mode, and several others.
- Basemaps serve as a foundational layer within the application. These show more detailed information as you zoom in.
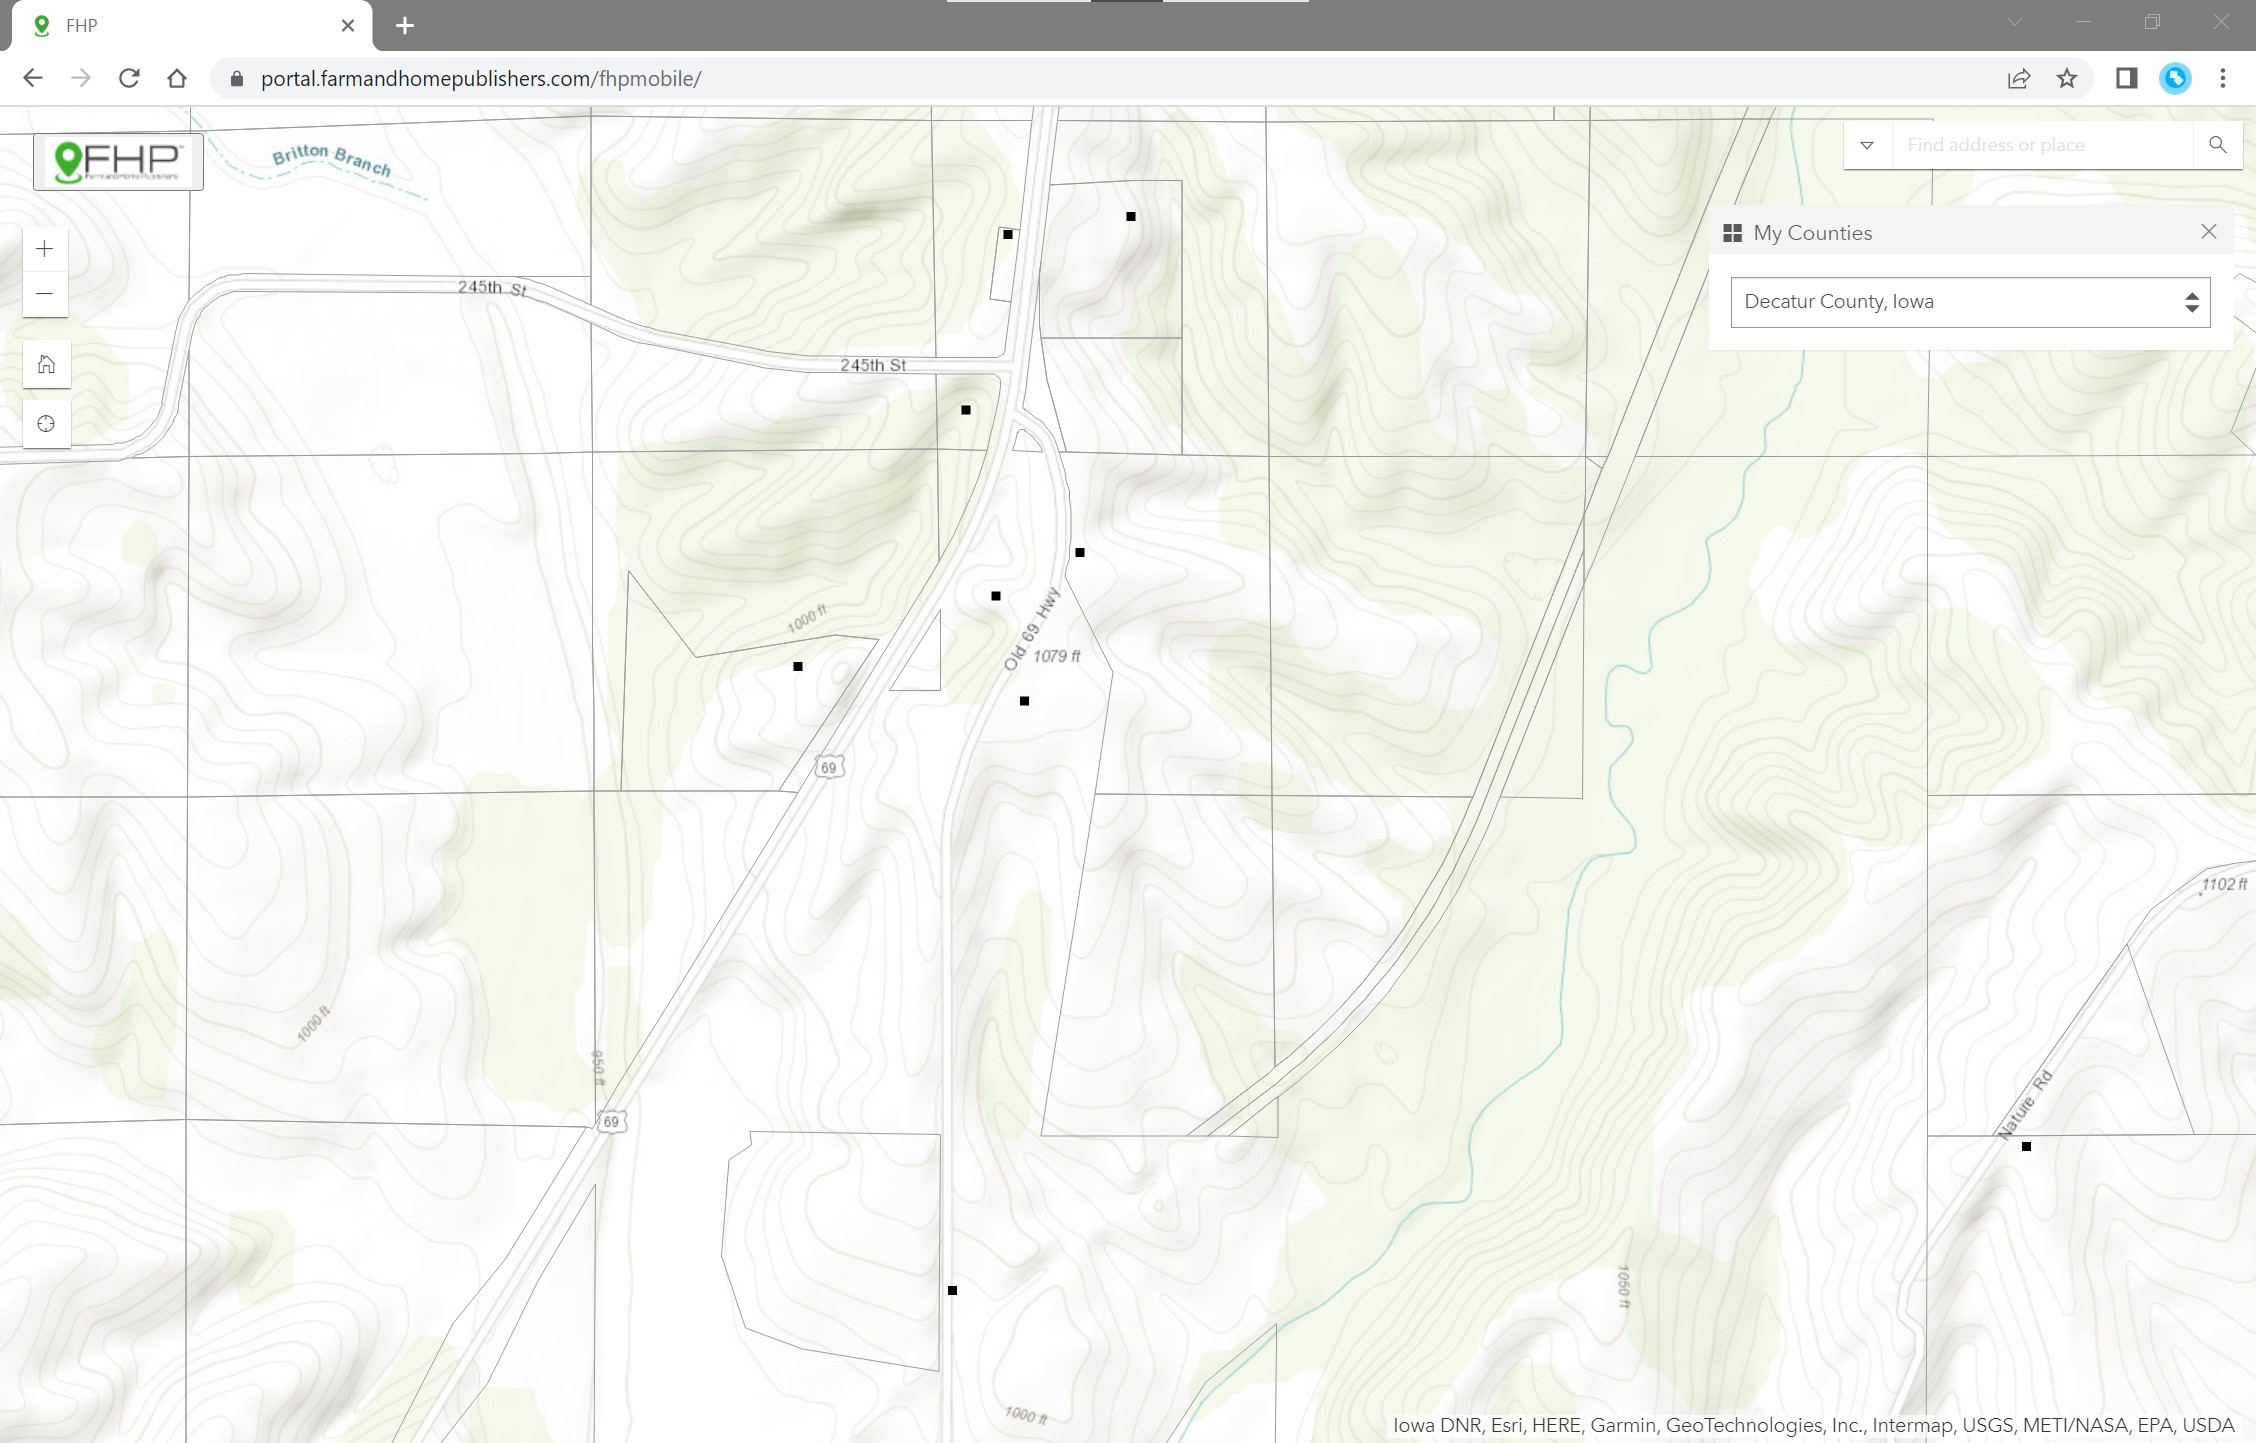
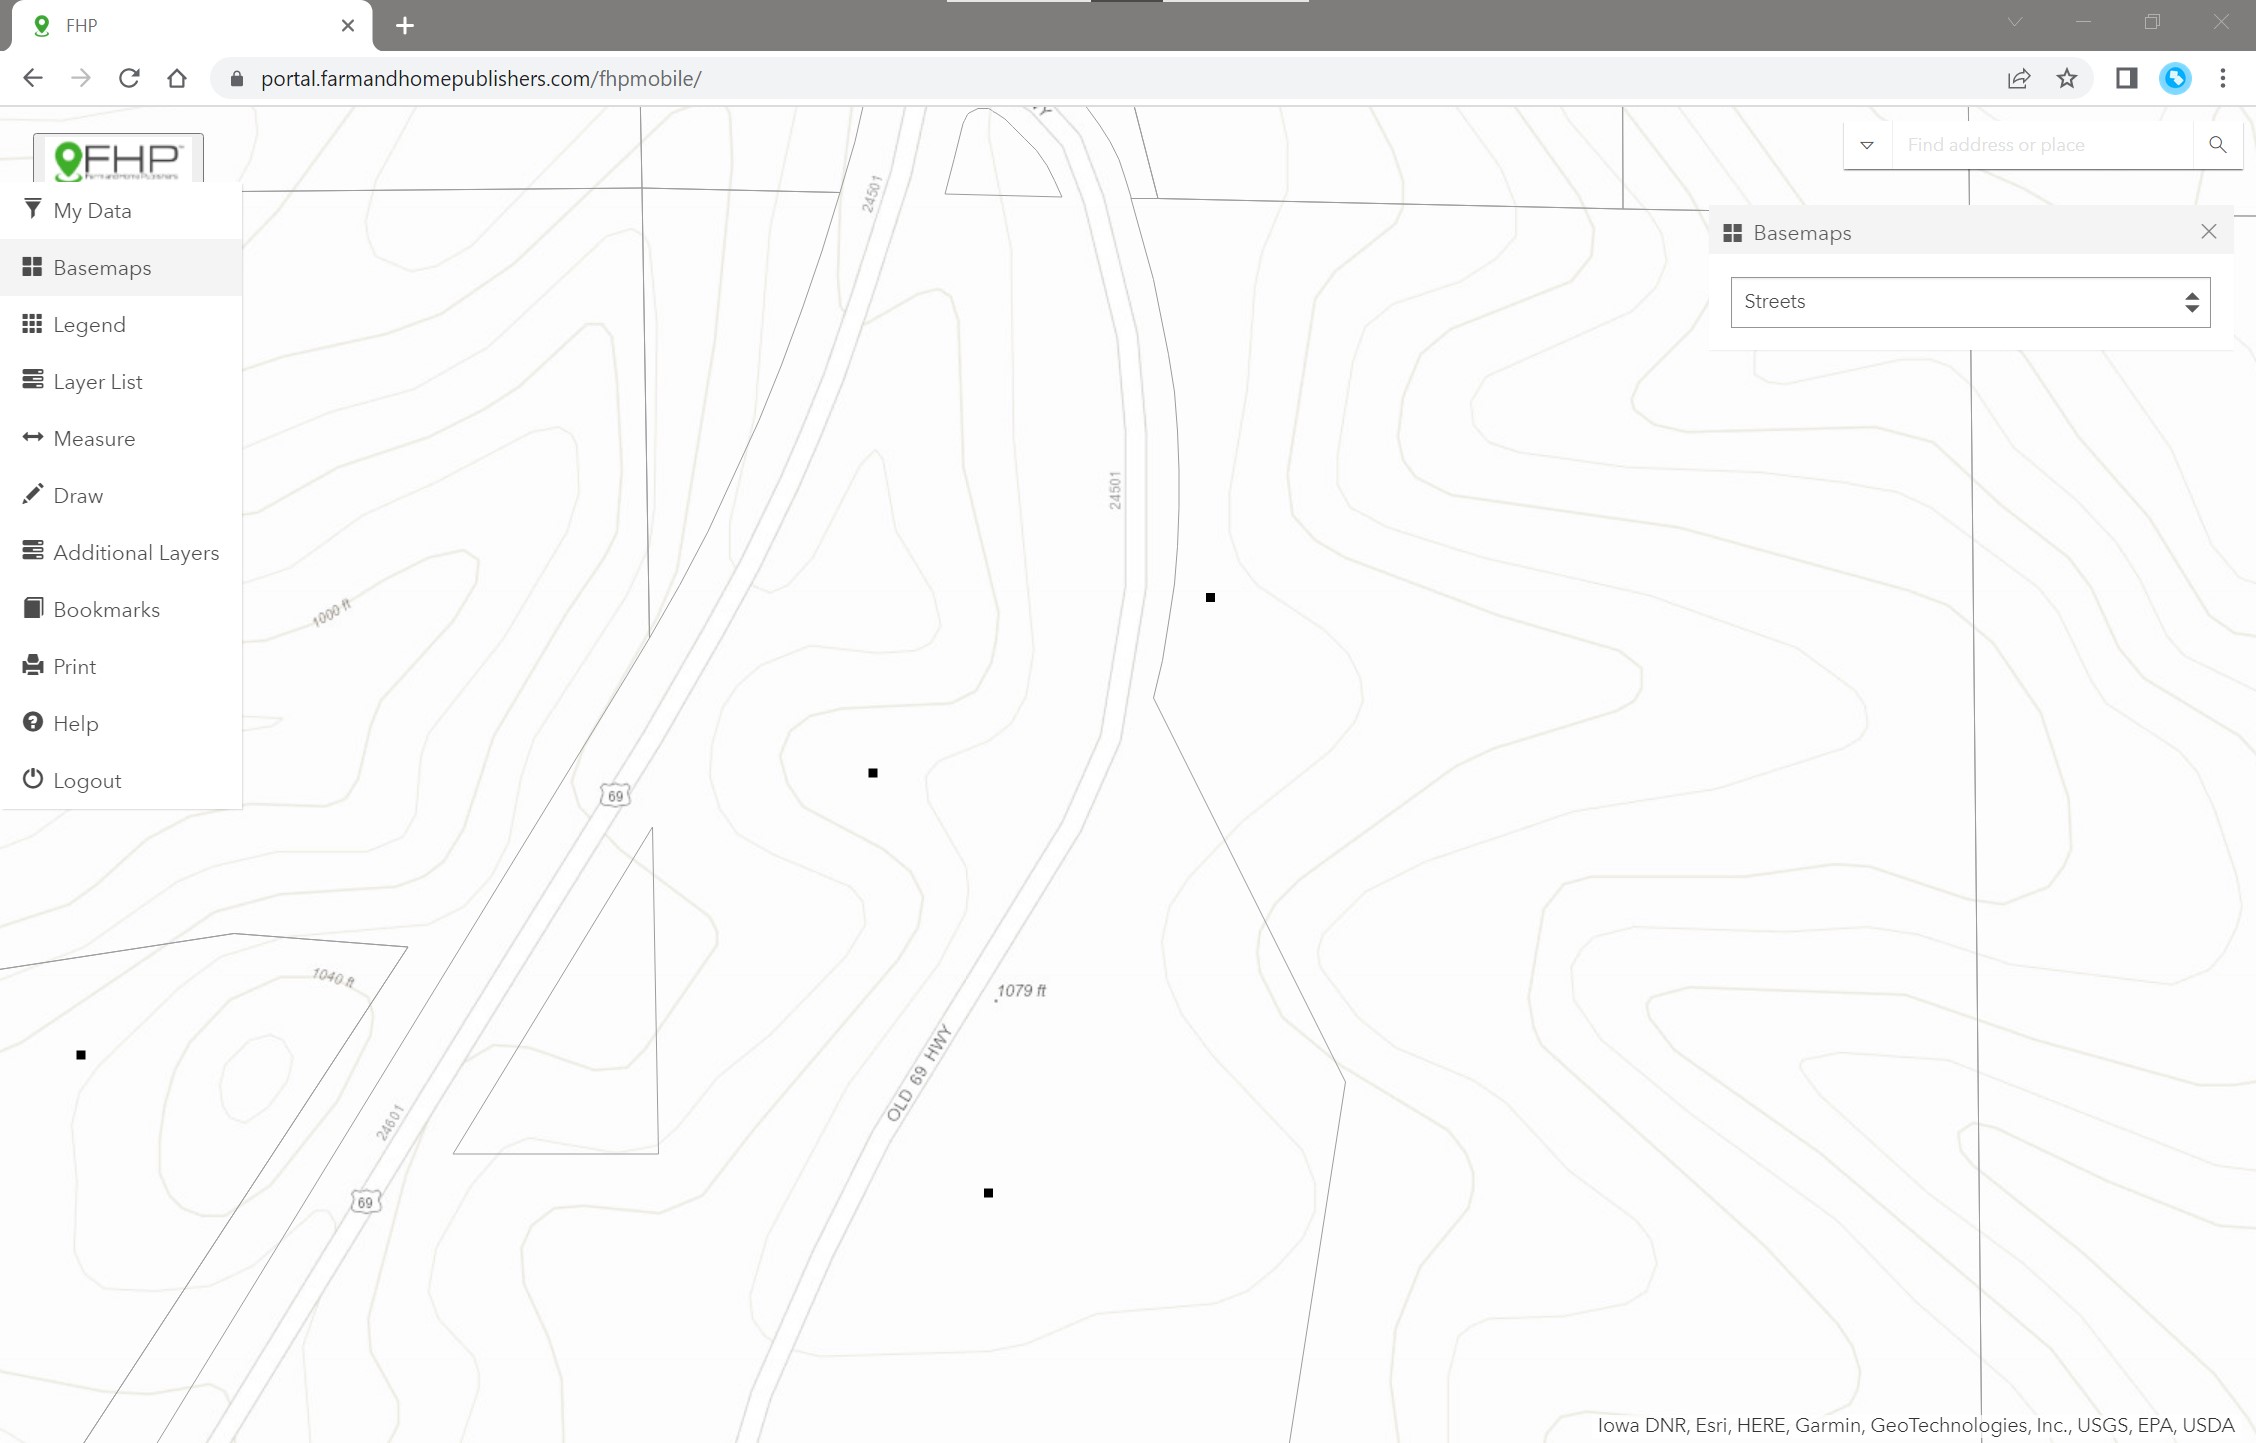
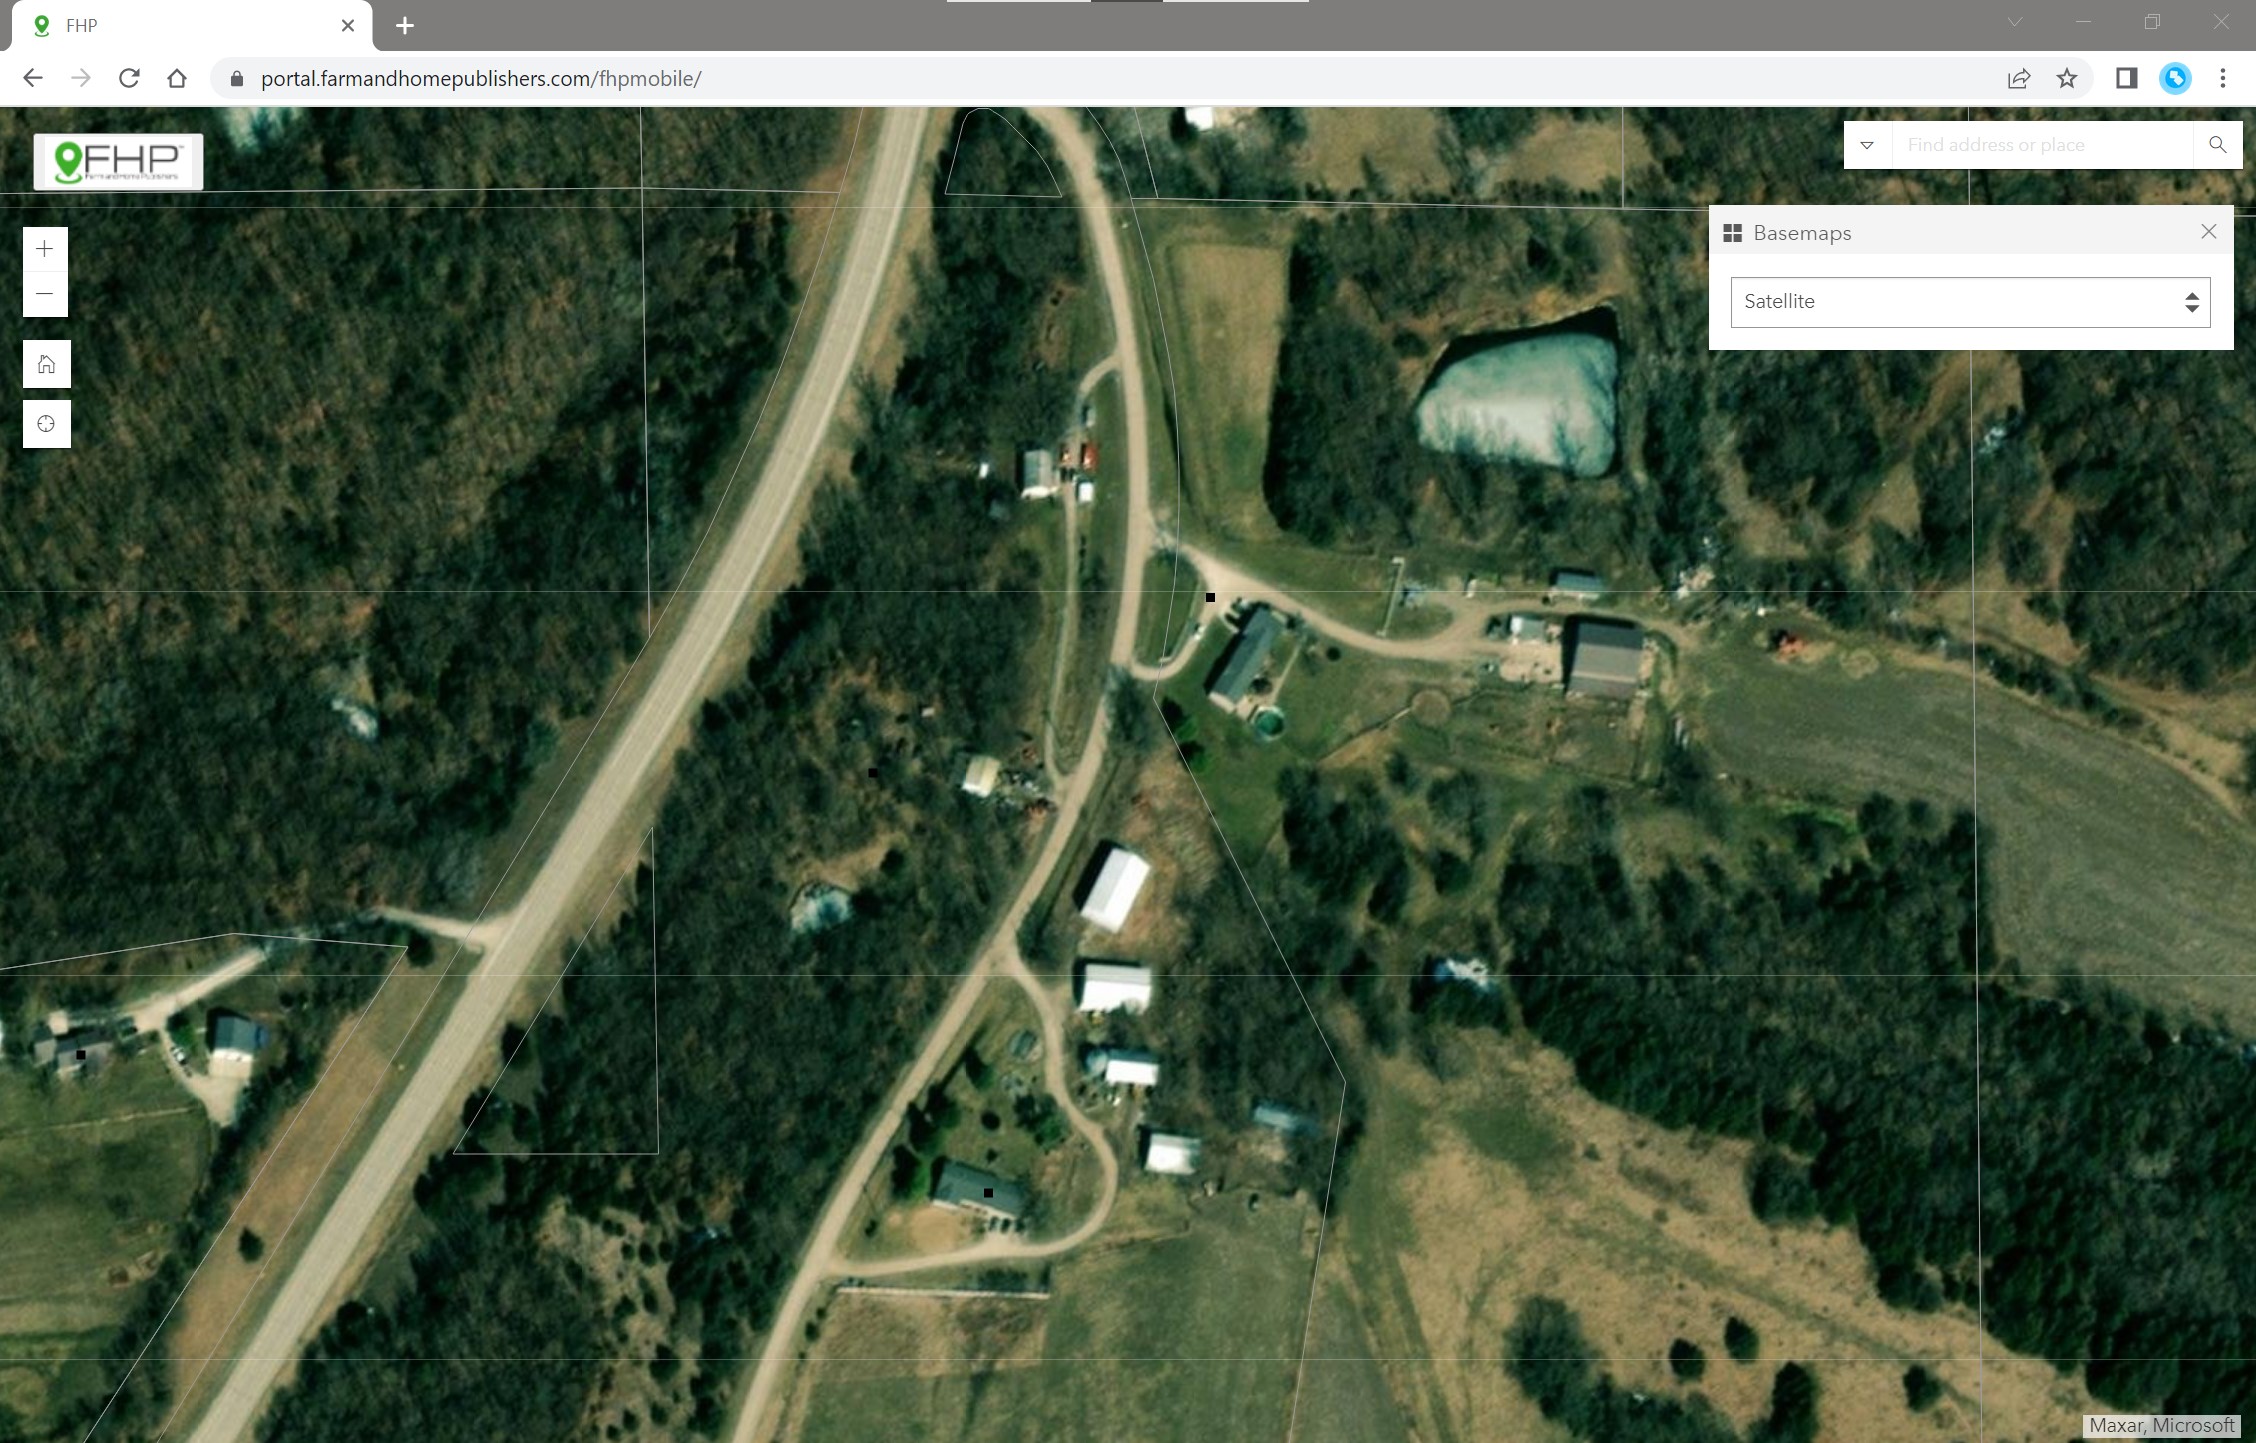
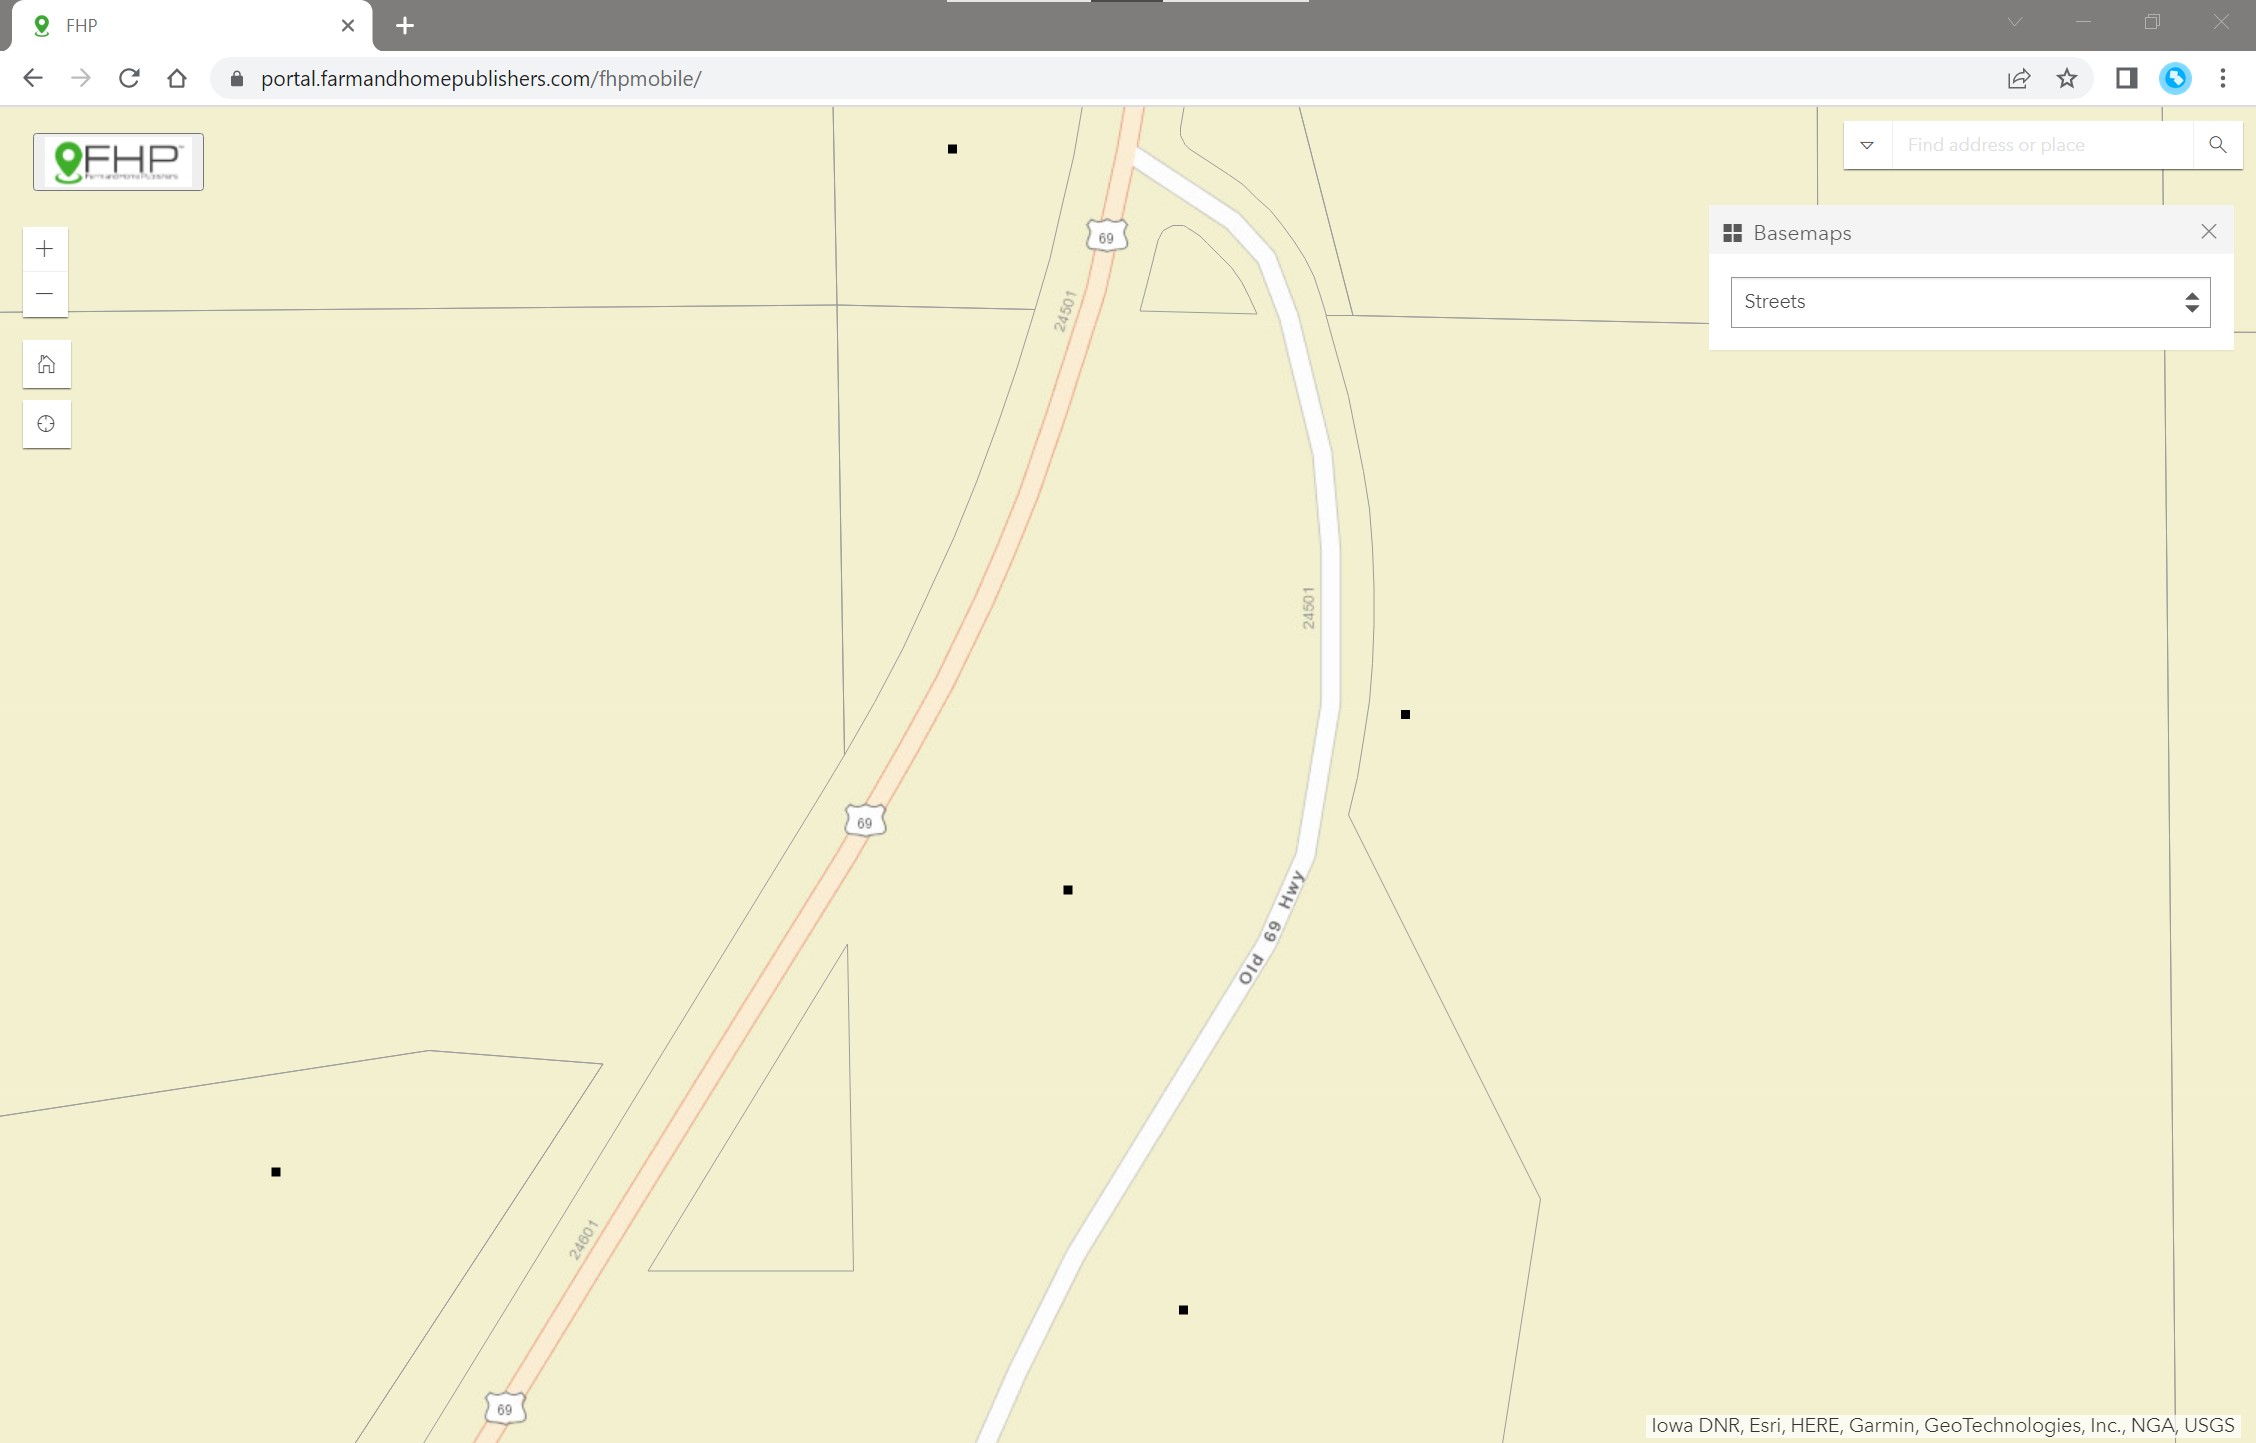
- The three images show:
a) The Topographic basemap, which is good for elevation and topographic information.
b) The Satellite basemap, showing best-available recent Satellite imagery from ERSI's service.
c) The Streets basemap, which shows roads and other navigation-related content.
- There are several other basemaps available.
Legend
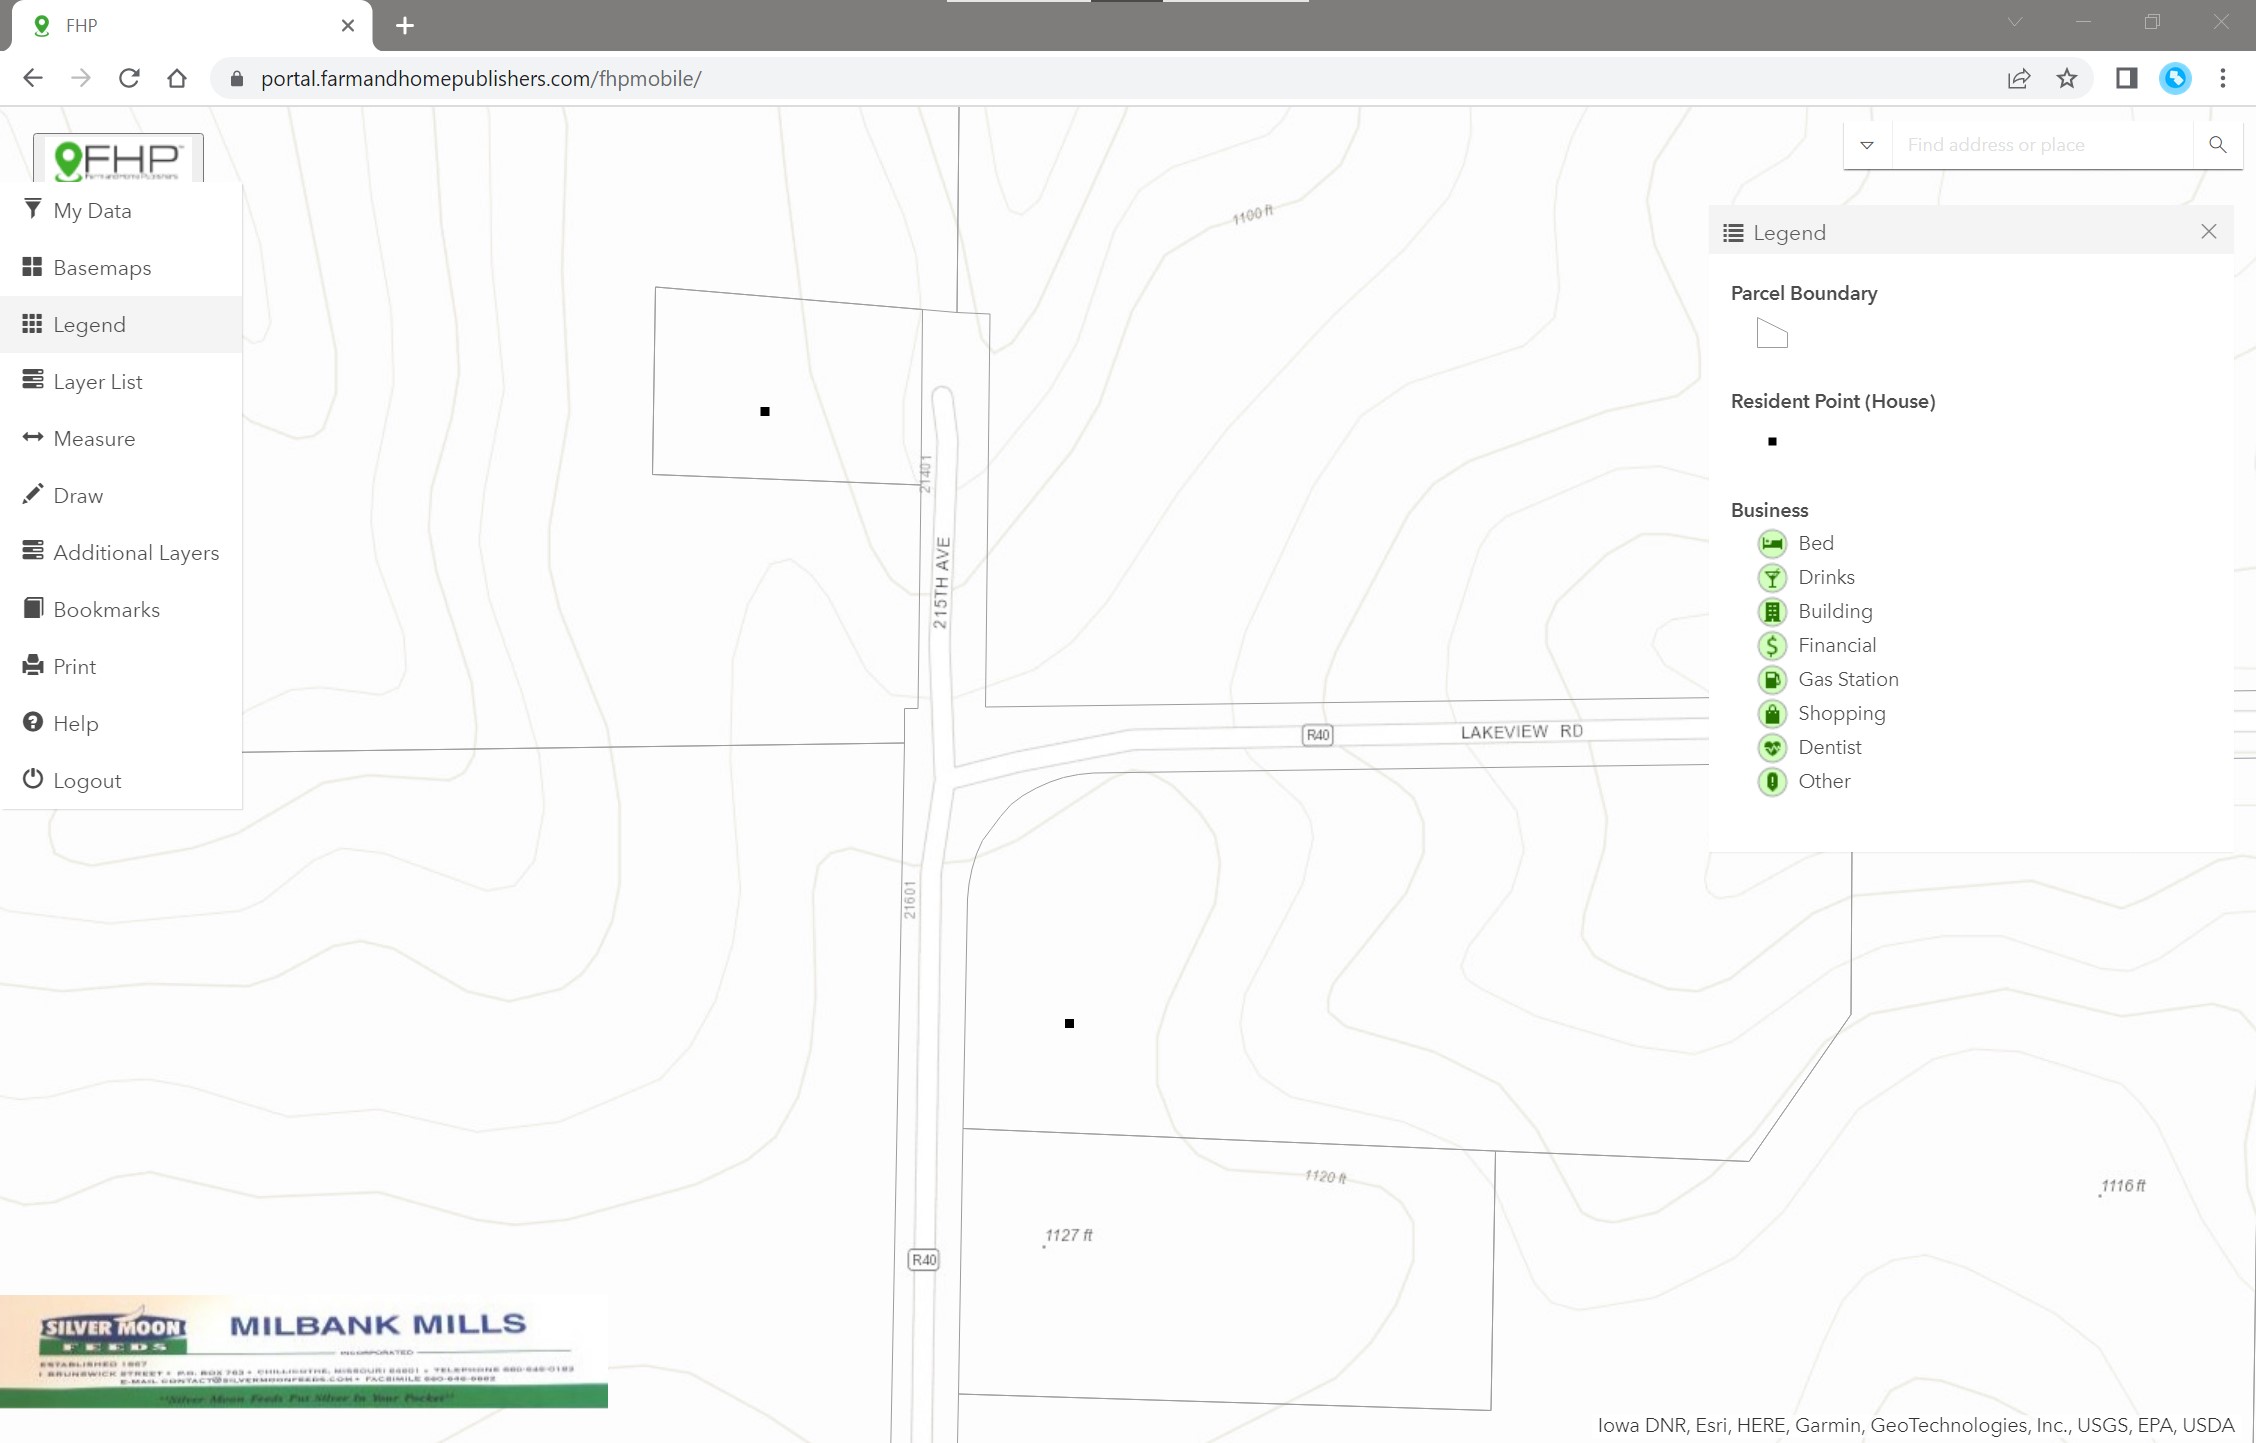
The Legend displays the layers that are active on the map. In the example shown in the photo, you can see the Parcel Boundary layer, Resident Point layer, and Business layer. As the user zooms in and out, or adds new layers, this Legend dynamically changes to reflect the current map view. In some cases, the layer in the Legend can be expanded to gain further information.
Layer List
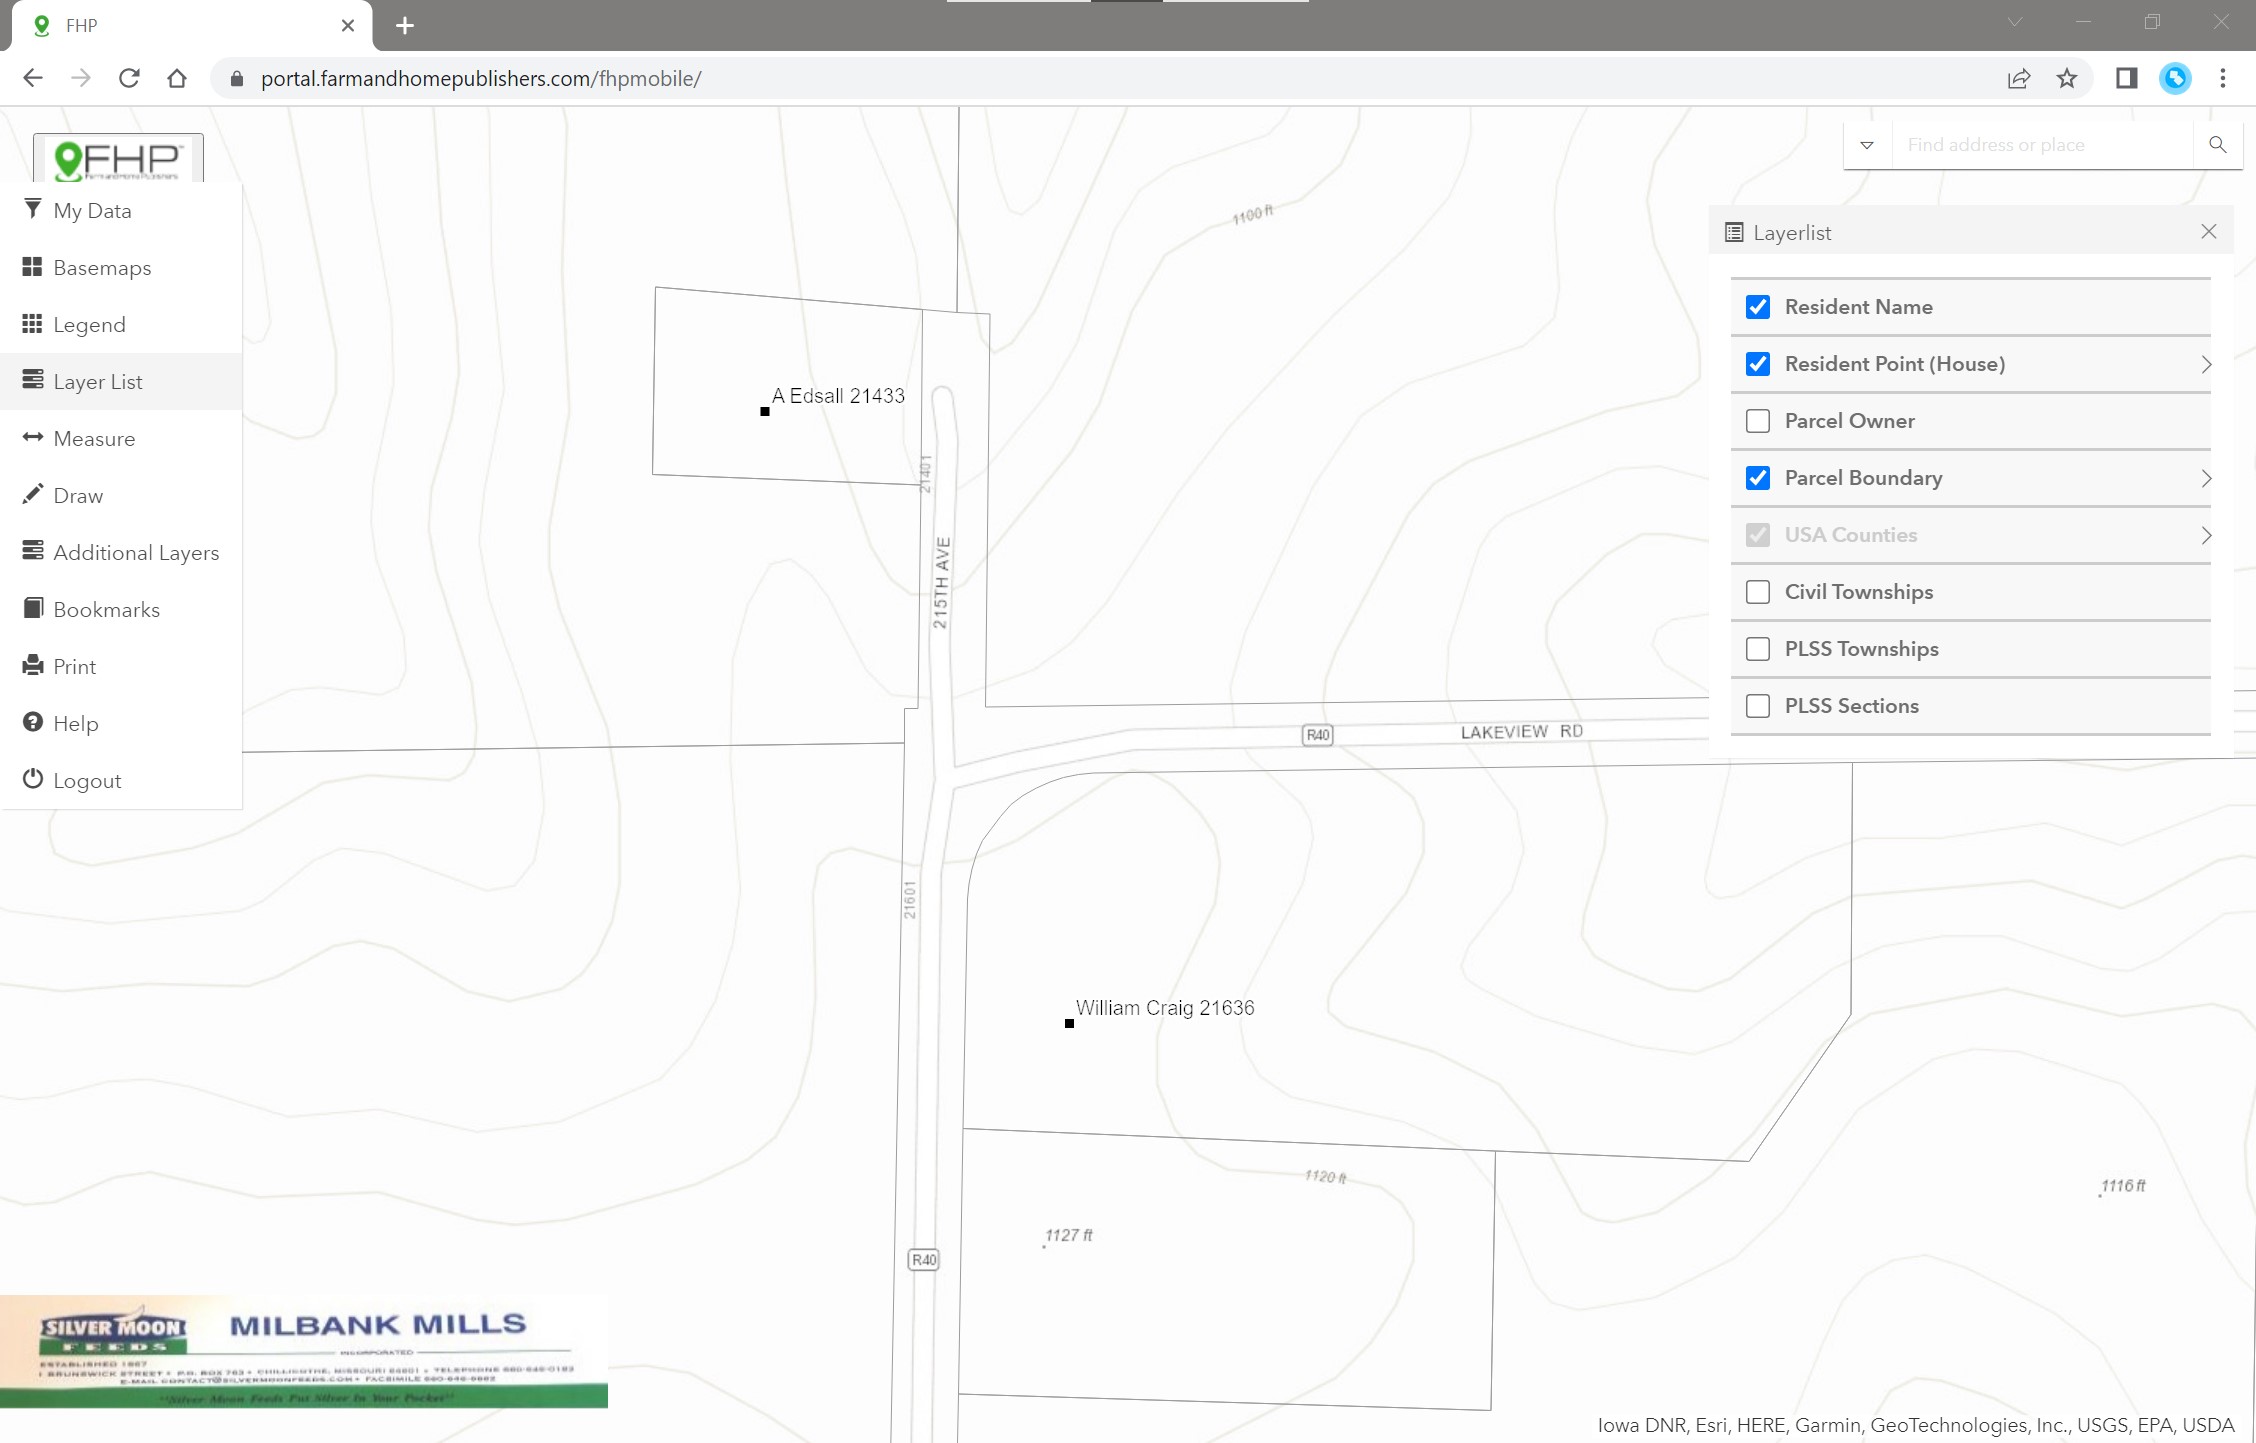
The Layer List tool is used to toggle layers on/off, which then are viewable on the map and the legend automatically.
Measure
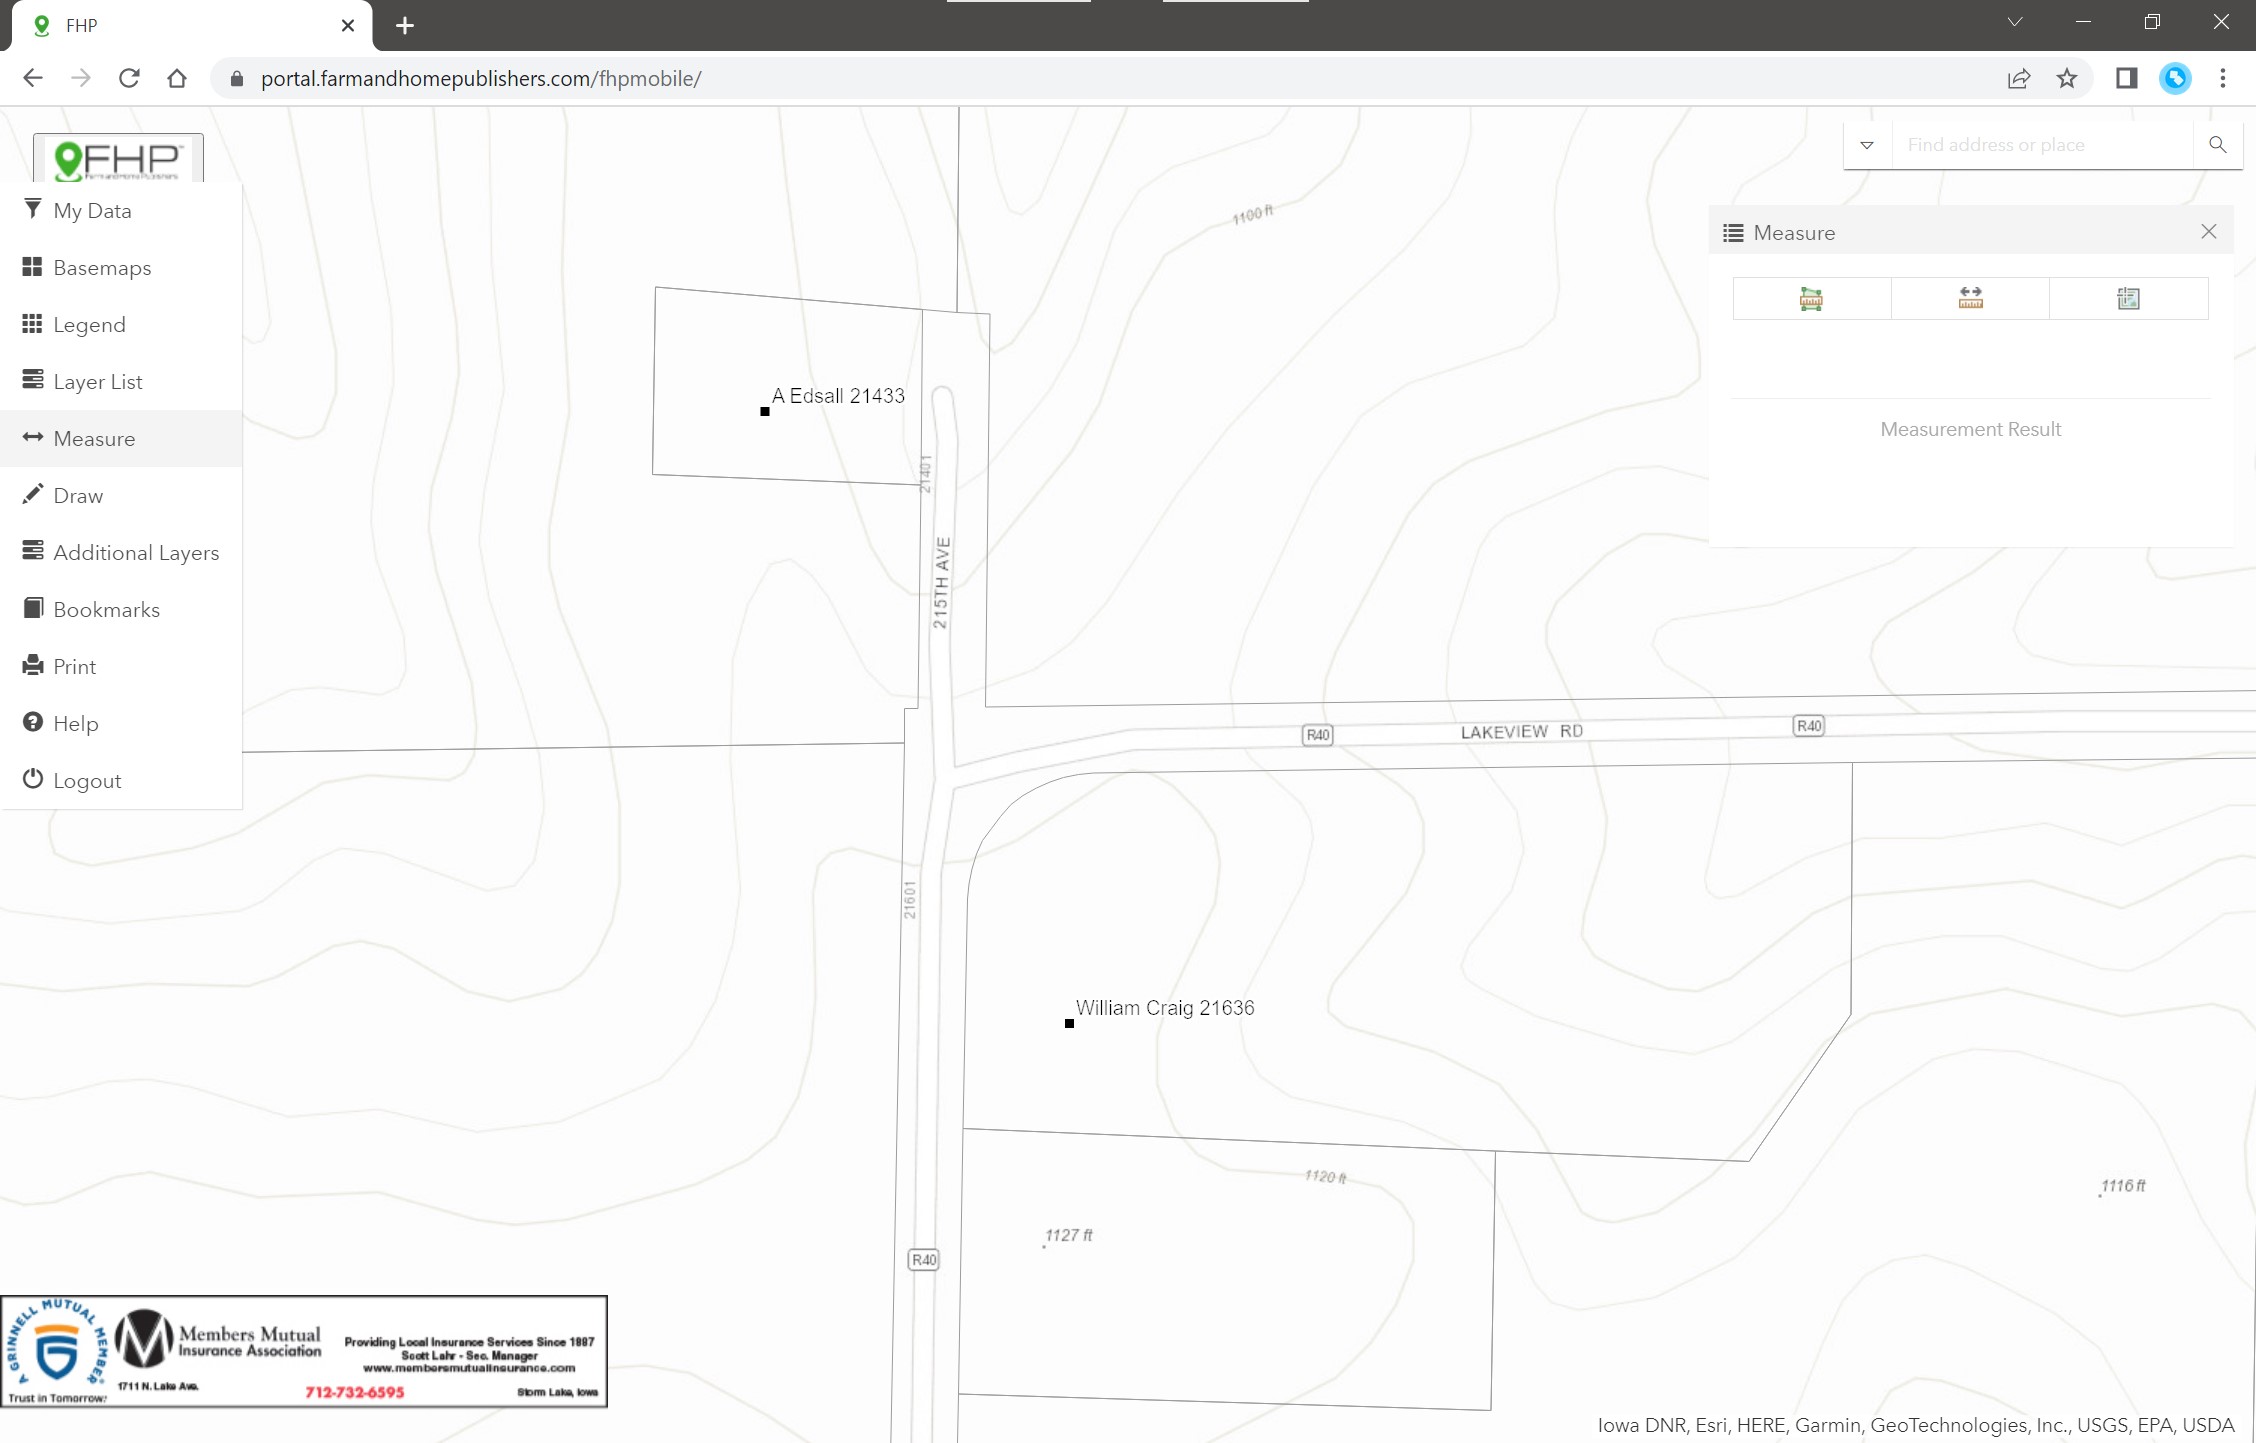
The Measure tool allows the user to interactively find the area, linear distance, or XY location on the map. The area and linear options have several units of measurement to choose from. The XY point option allows for decimal degrees or degrees-minutes-seconds.
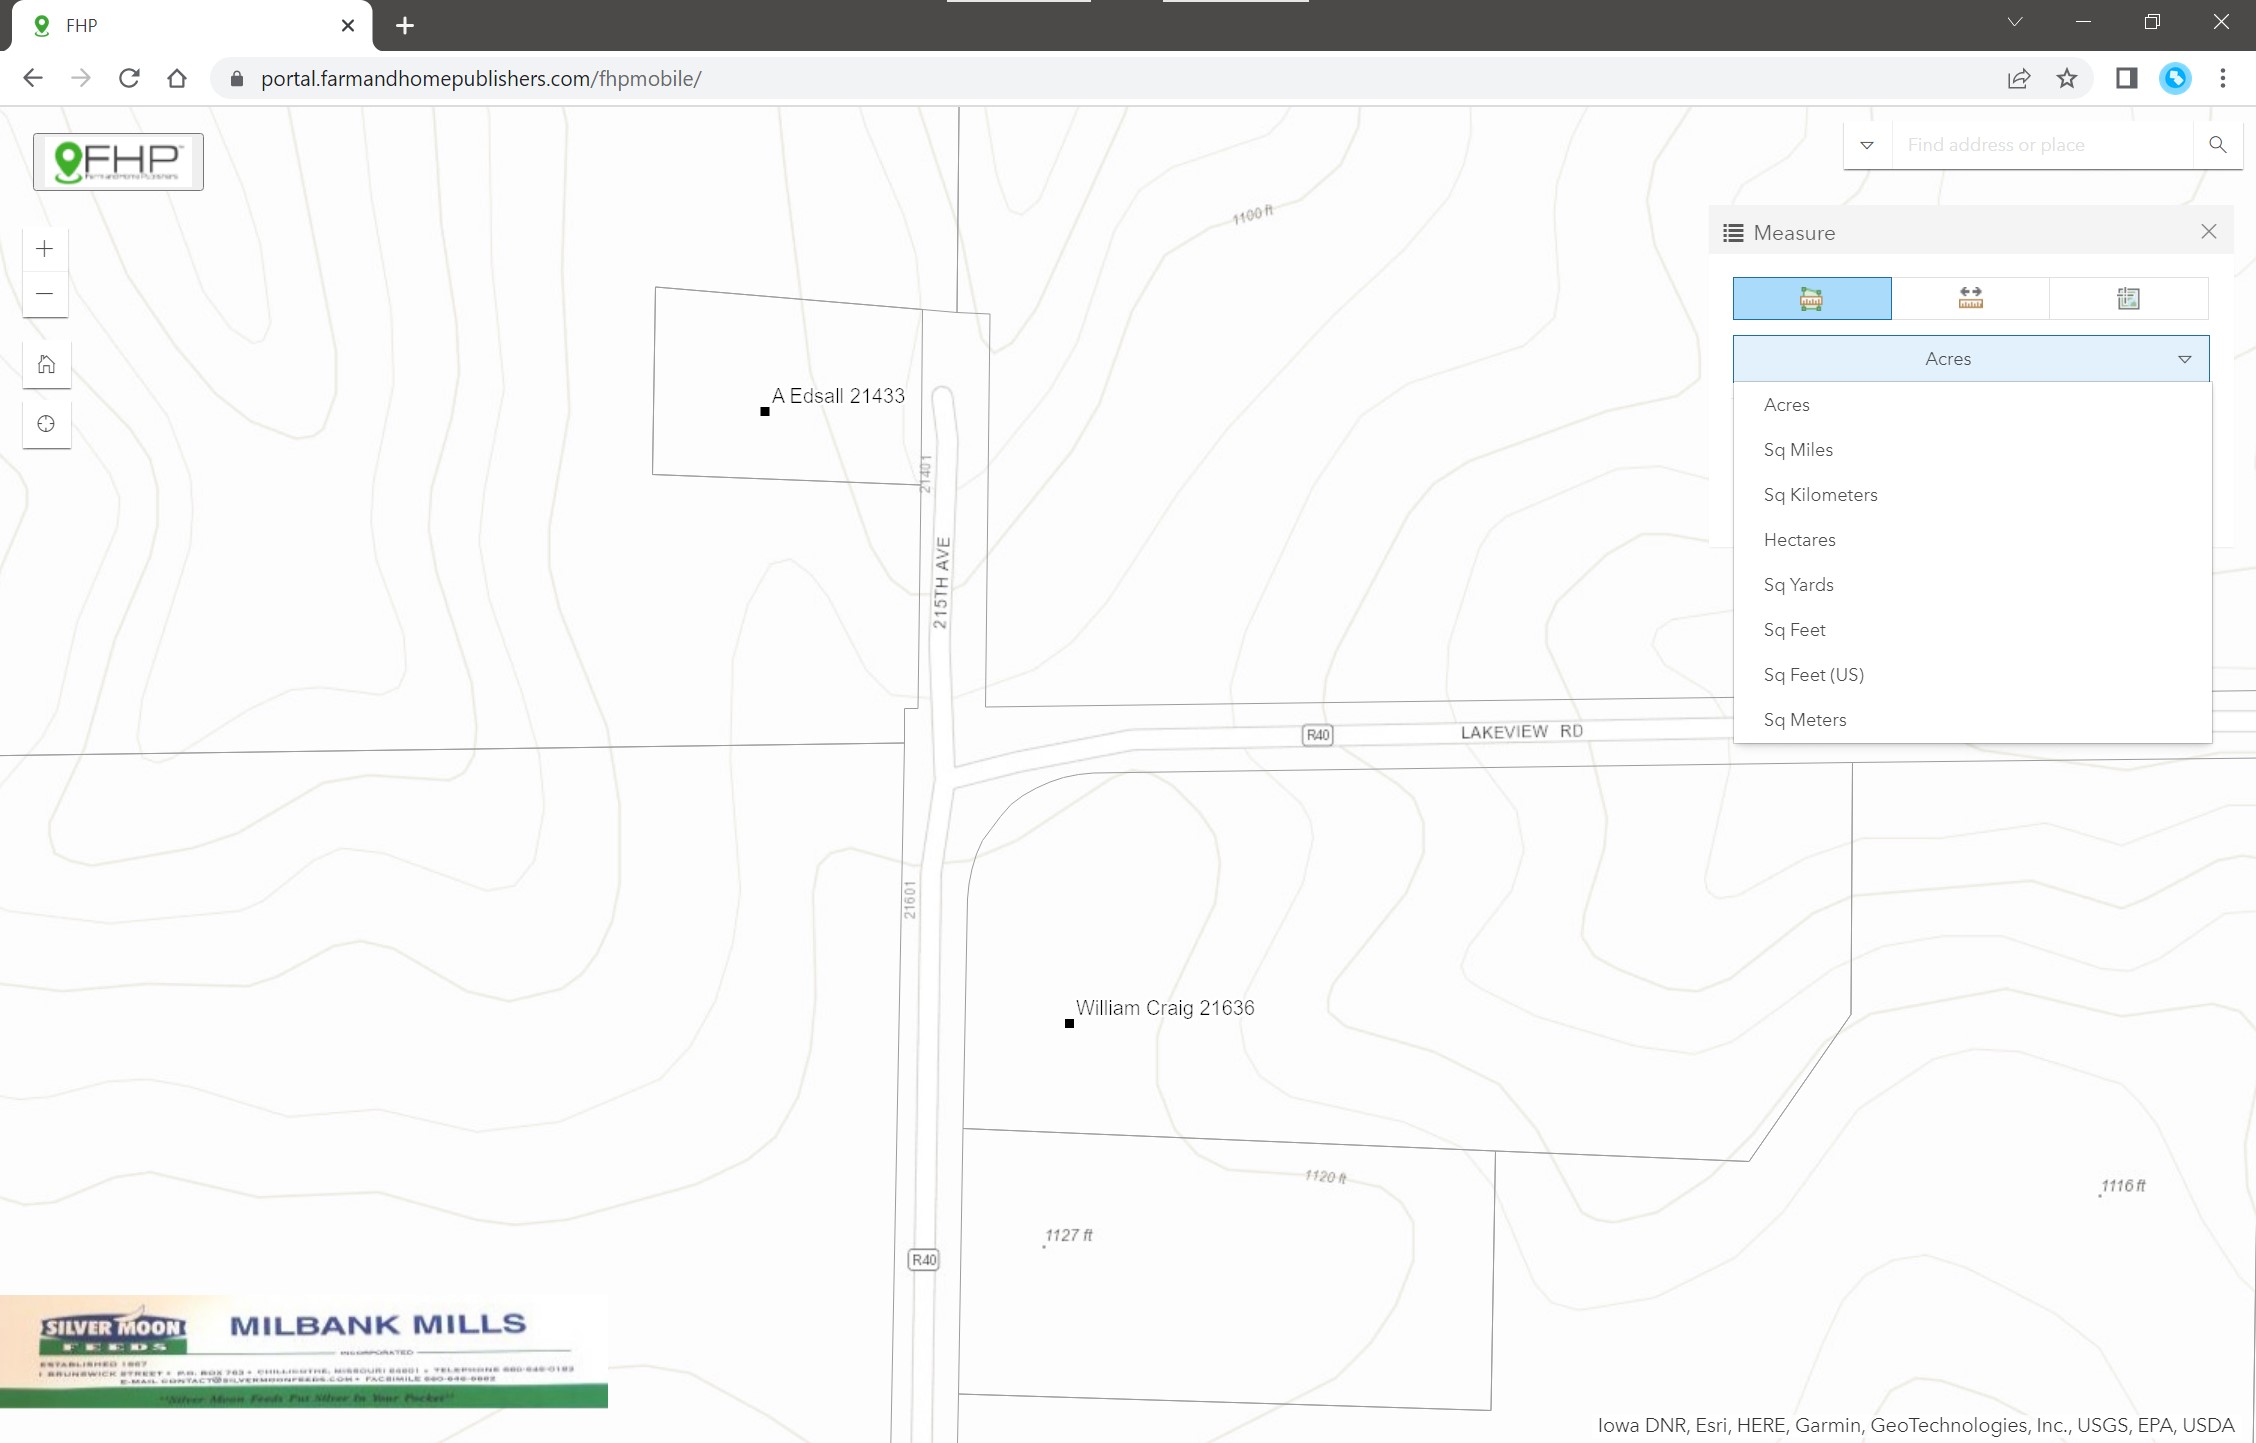
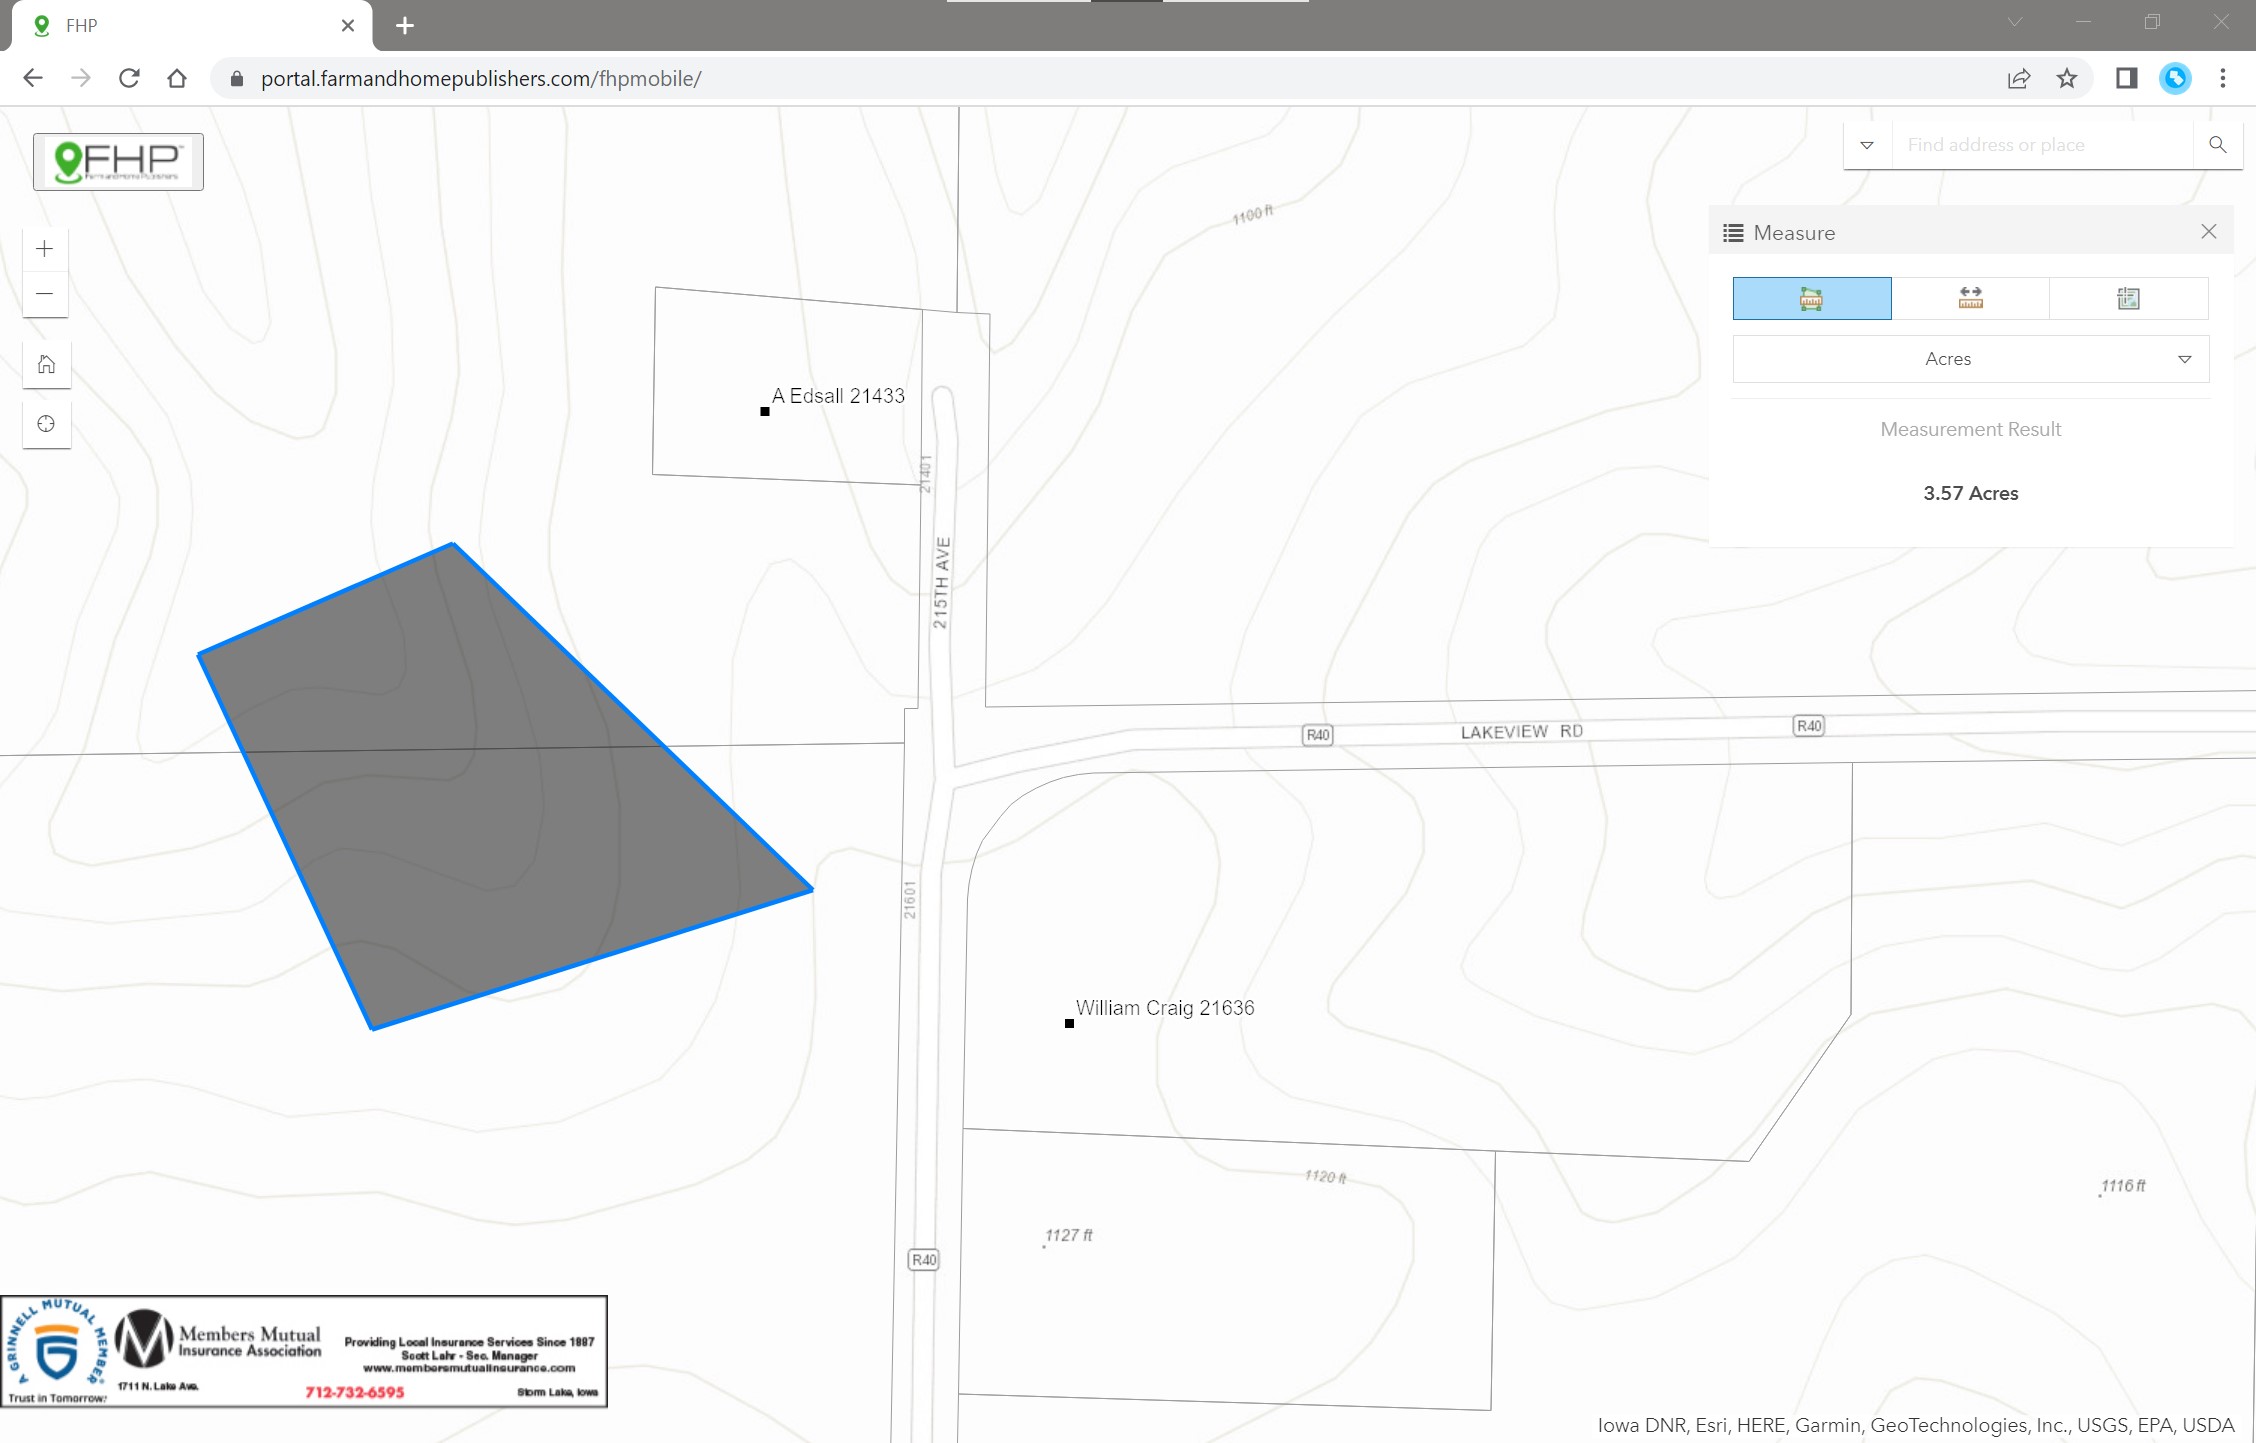
The area/polygon tool has several different unit options to choose from. To use the tool:
1) Click the Area button to activate the tool.
2) Select the unit of measurement from the dropdown list.
3) Click on the map and click for each vertex of the area.
4) Double-click to finish the drawing.
5) View the calculated area.
Note that this tool is handy for estimating acreage when splitting and consolidating lots against the parcel data, or the size of a pond when using Satellite imagery, among other things.

Similarly, the distance/line option on the Measure tool has several units of measurement to choose from as well. To use the tool:
1) Click the Line button to activate the tool.
2) Select the unit of measurement from the dropdown list.
3) Click on the map and click for each vertex of the line.
4) Double-click to finish the drawing.
5) View the calculated distance.
Note that this tool is handy for estimating route distance or a feature length, such as tracing a lane or long driveway from the Satellite imagery basemap.
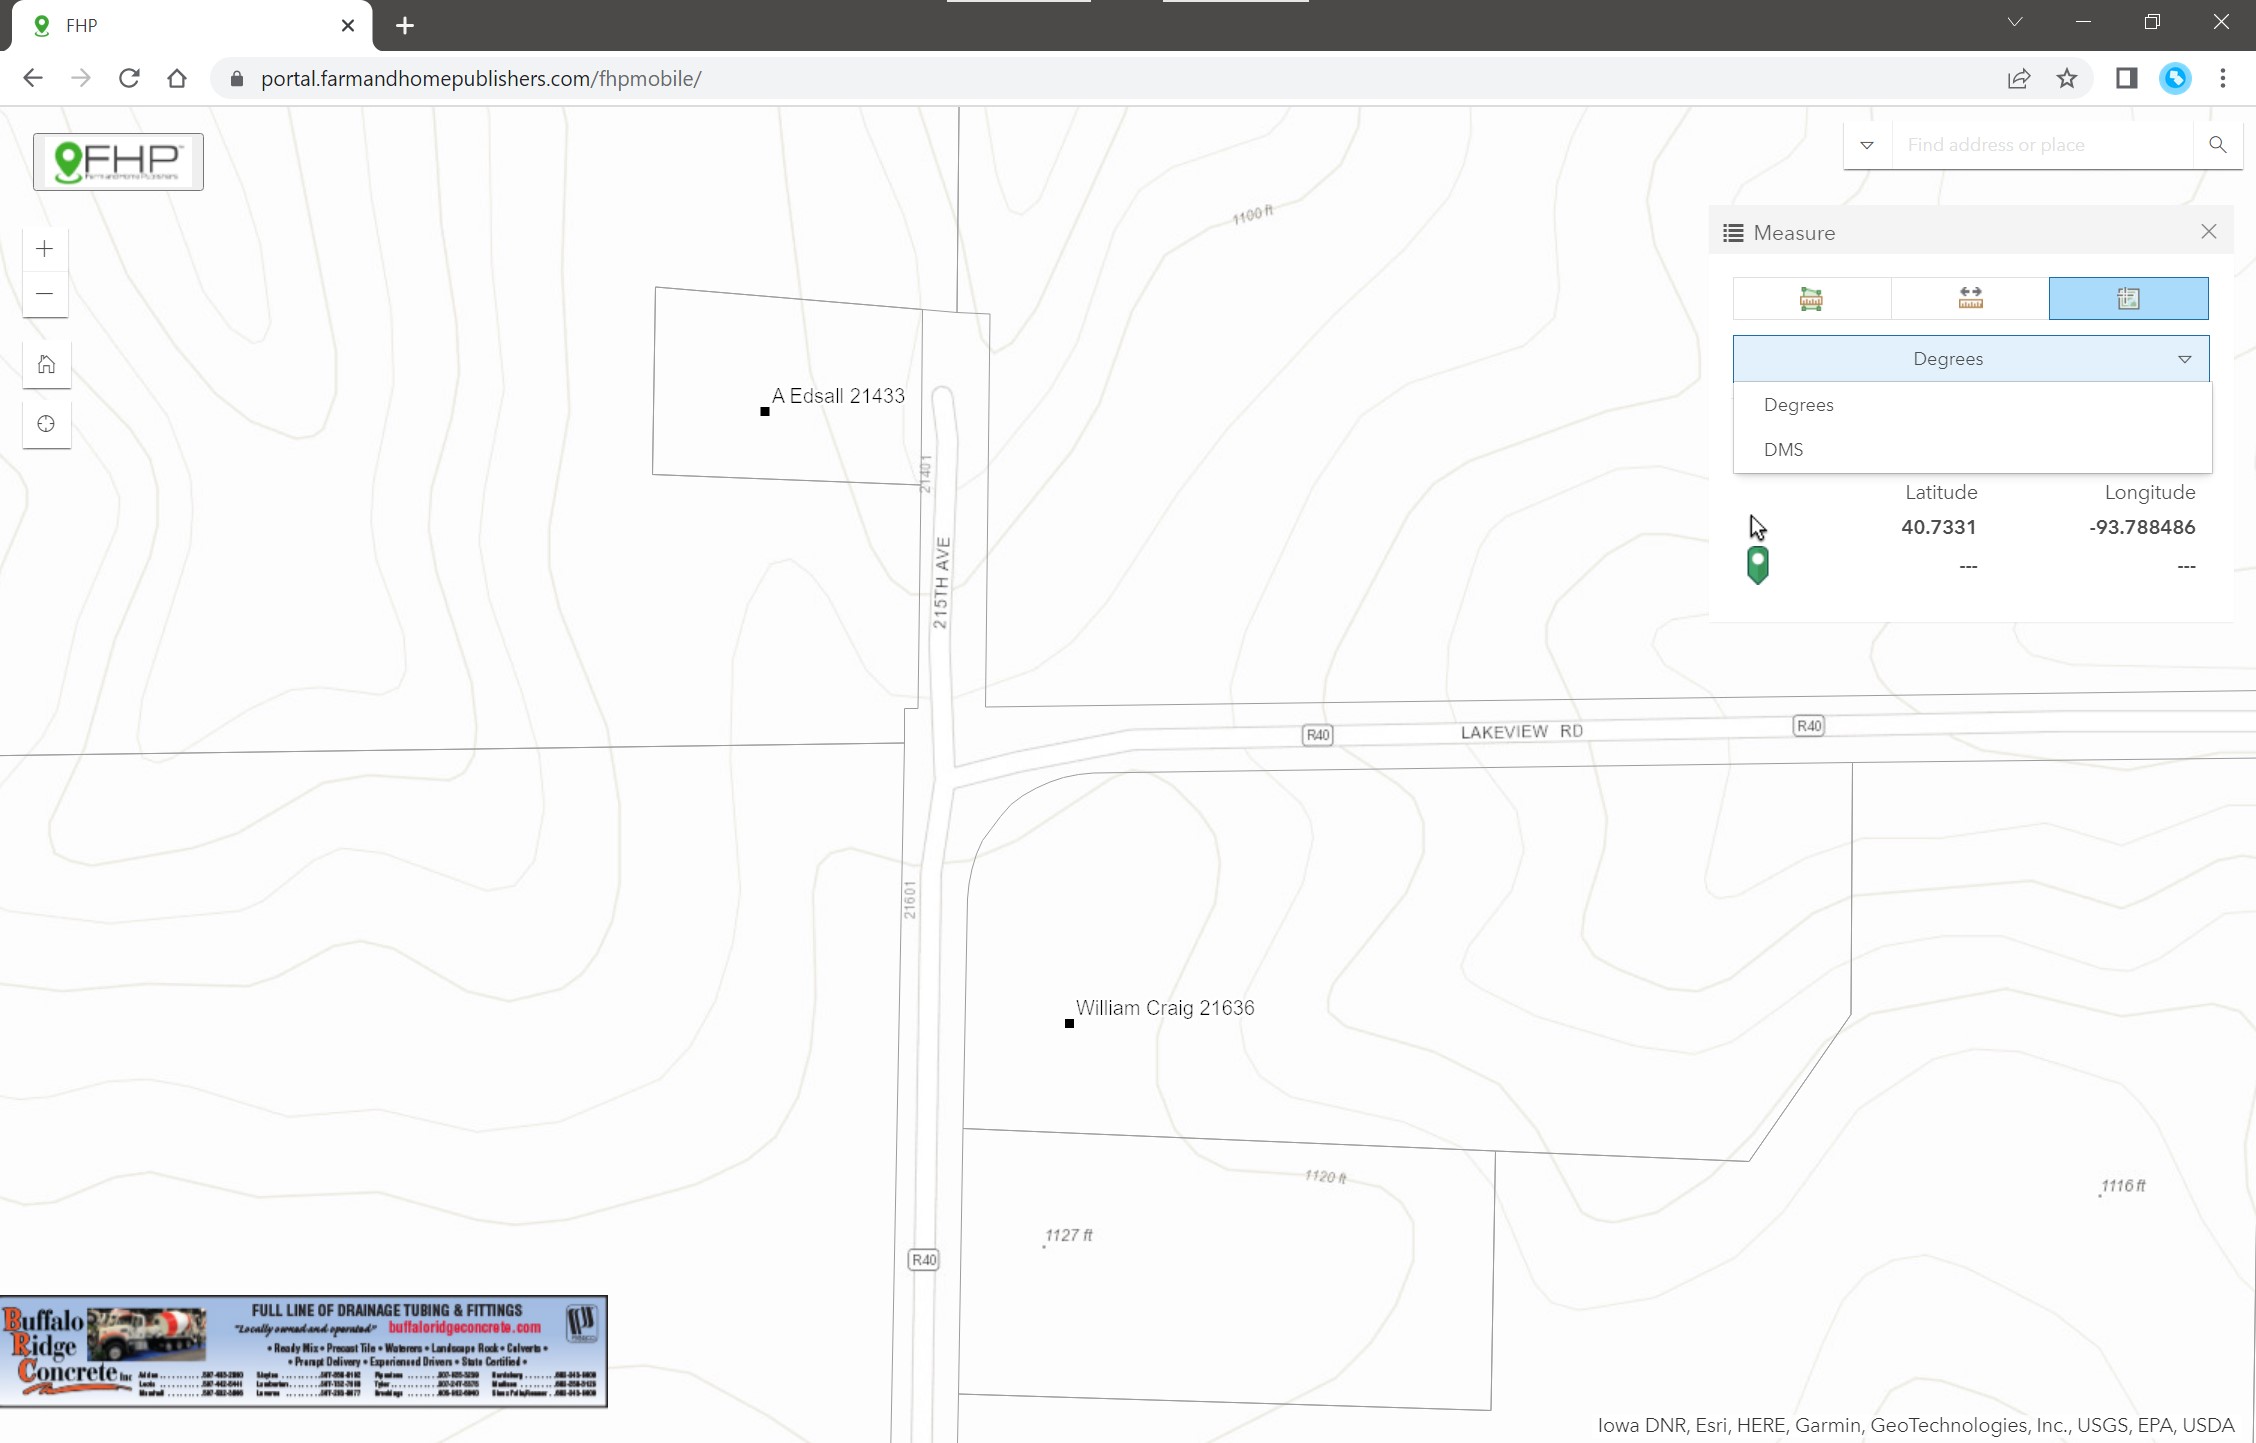
The point tool allows the user to view the coordinates of a location in either Decimal Degrees or DMS (Degrees Minutes Seconds).
Draw
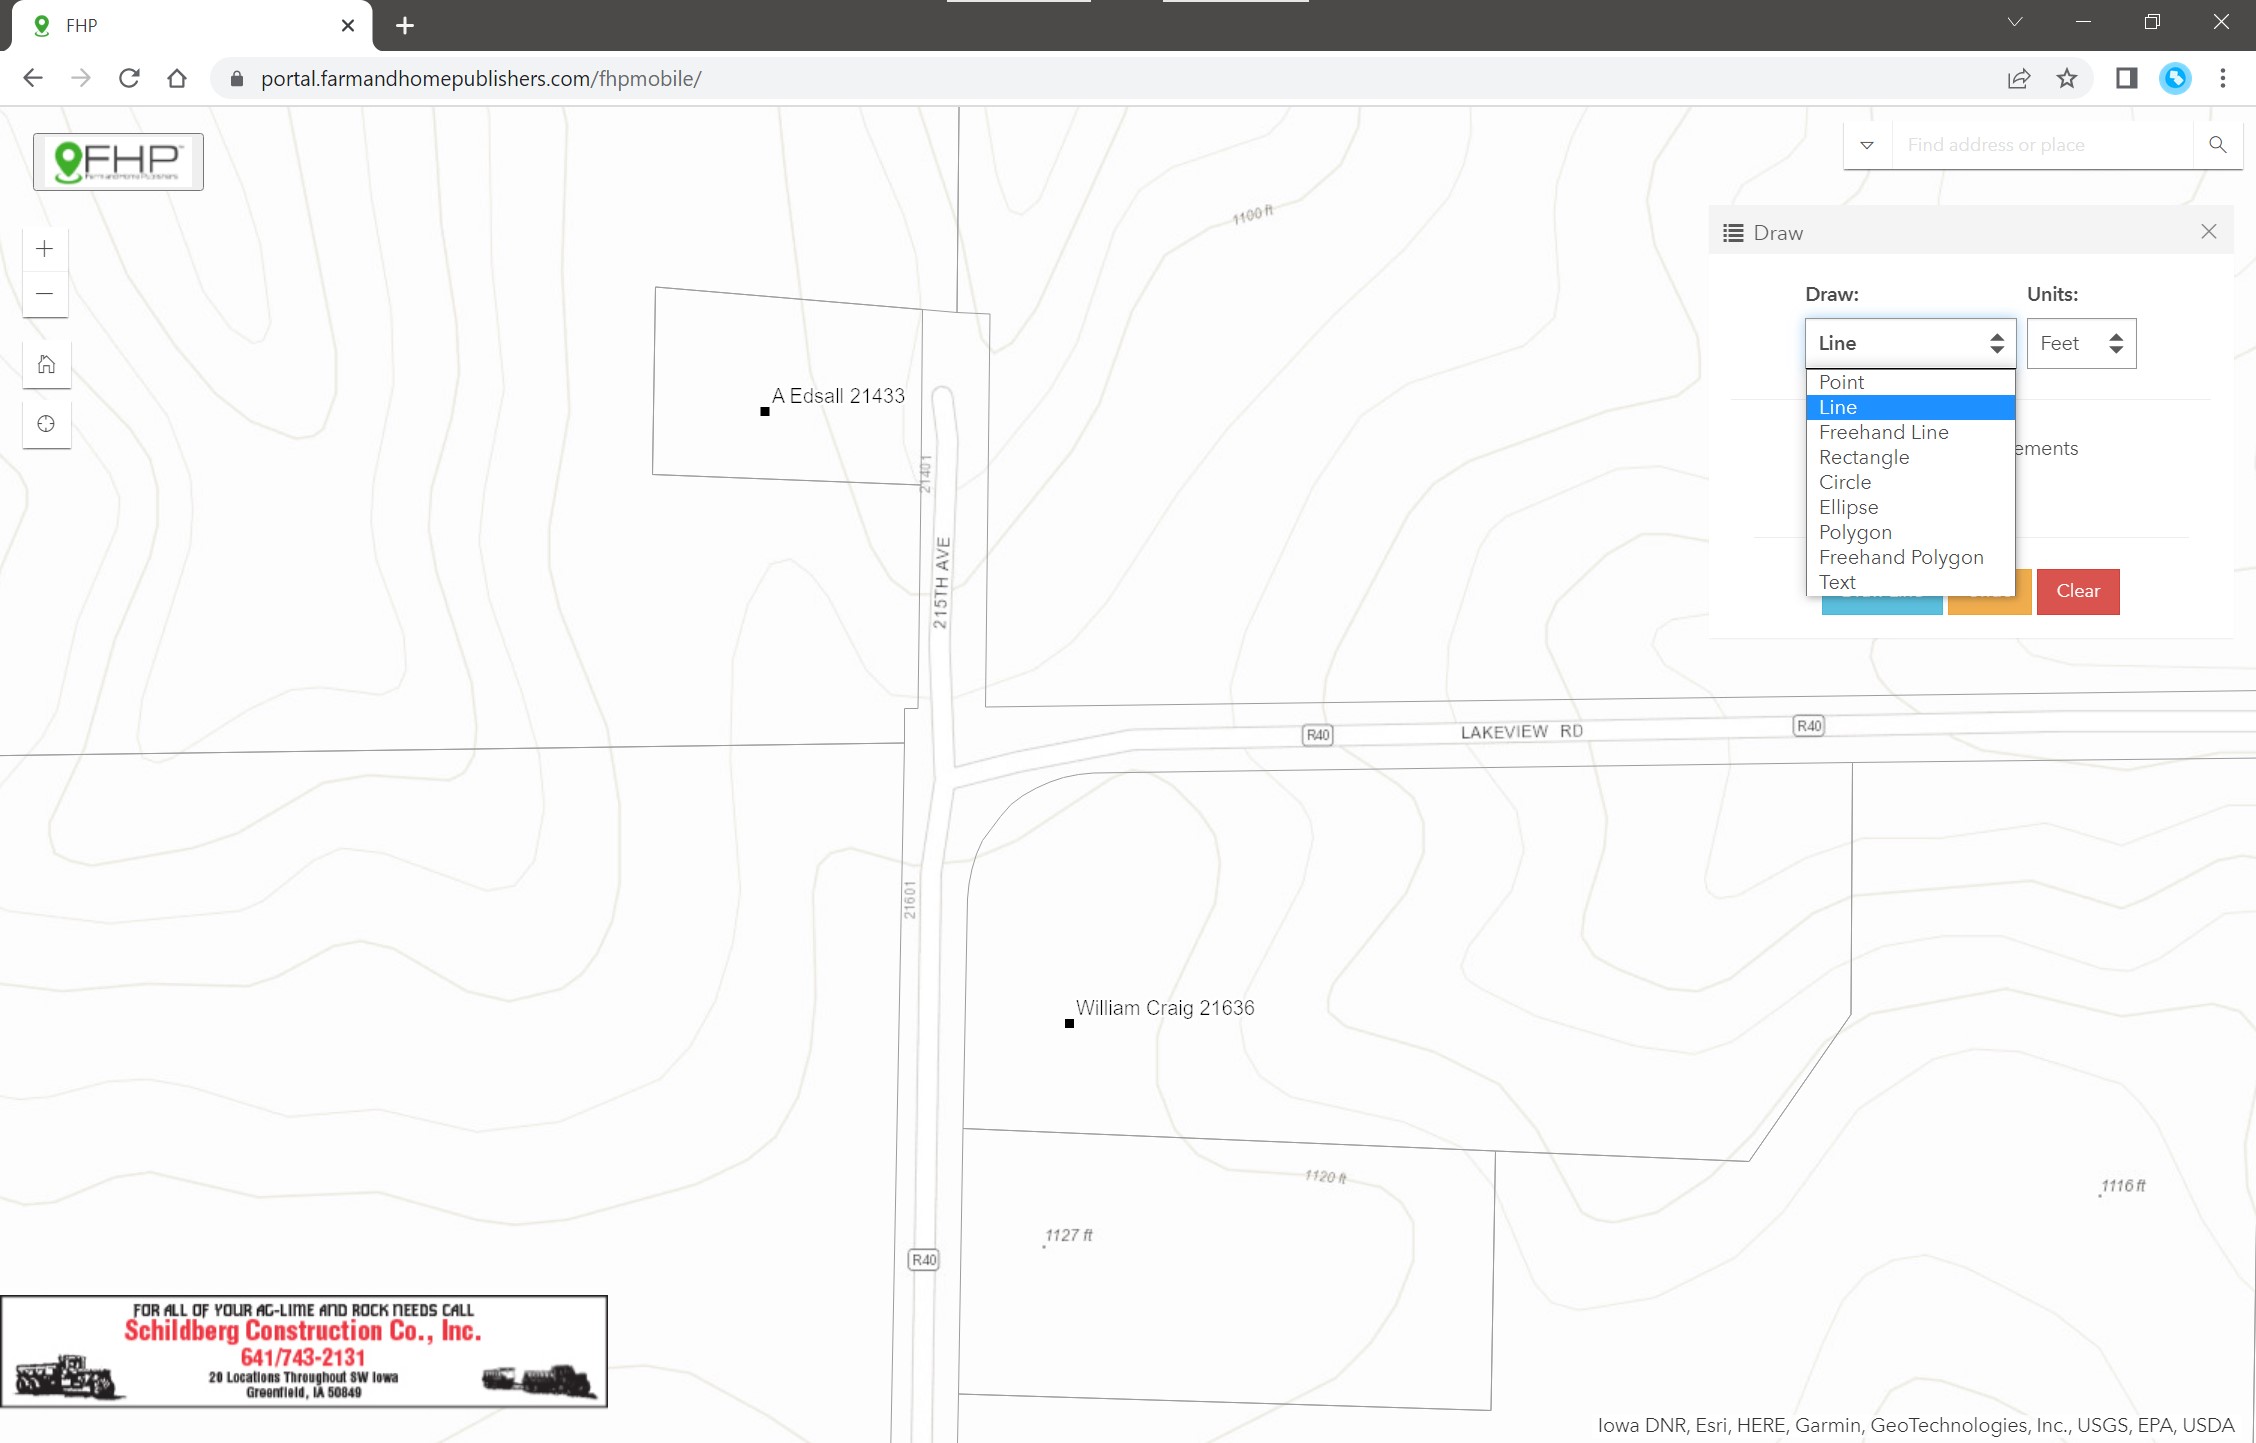
The Draw tool is a custom tool that extends the Measure tool functions, to retain the drawings as markups for the duration of the user's session (or until you clear the markups from your map). Additionally, Draw enables annotating the markups by checking the "Label Measurements" checkbox. Like the Measure tool, there are three geometry types to choose from - Area, Line, and Point. However, in addition, Text markups are also an option, allowing the user to add notes to the map during their session.
For geometric markups, in addition to the point-and-click interaction options like with Measure, there are additional methods for adding the geometry onto the map. Notable ones are Rectangle, Circle, as well as Freehand Polygon, and Freehand Line. Freehand options are performed in Desktop mode via a continuous left-mouse-click, drag, and draw. For the mobile app, this is a long-press and drag. In the case of the mobile user, the Freehand options easy to add a line or area markup onto the map.
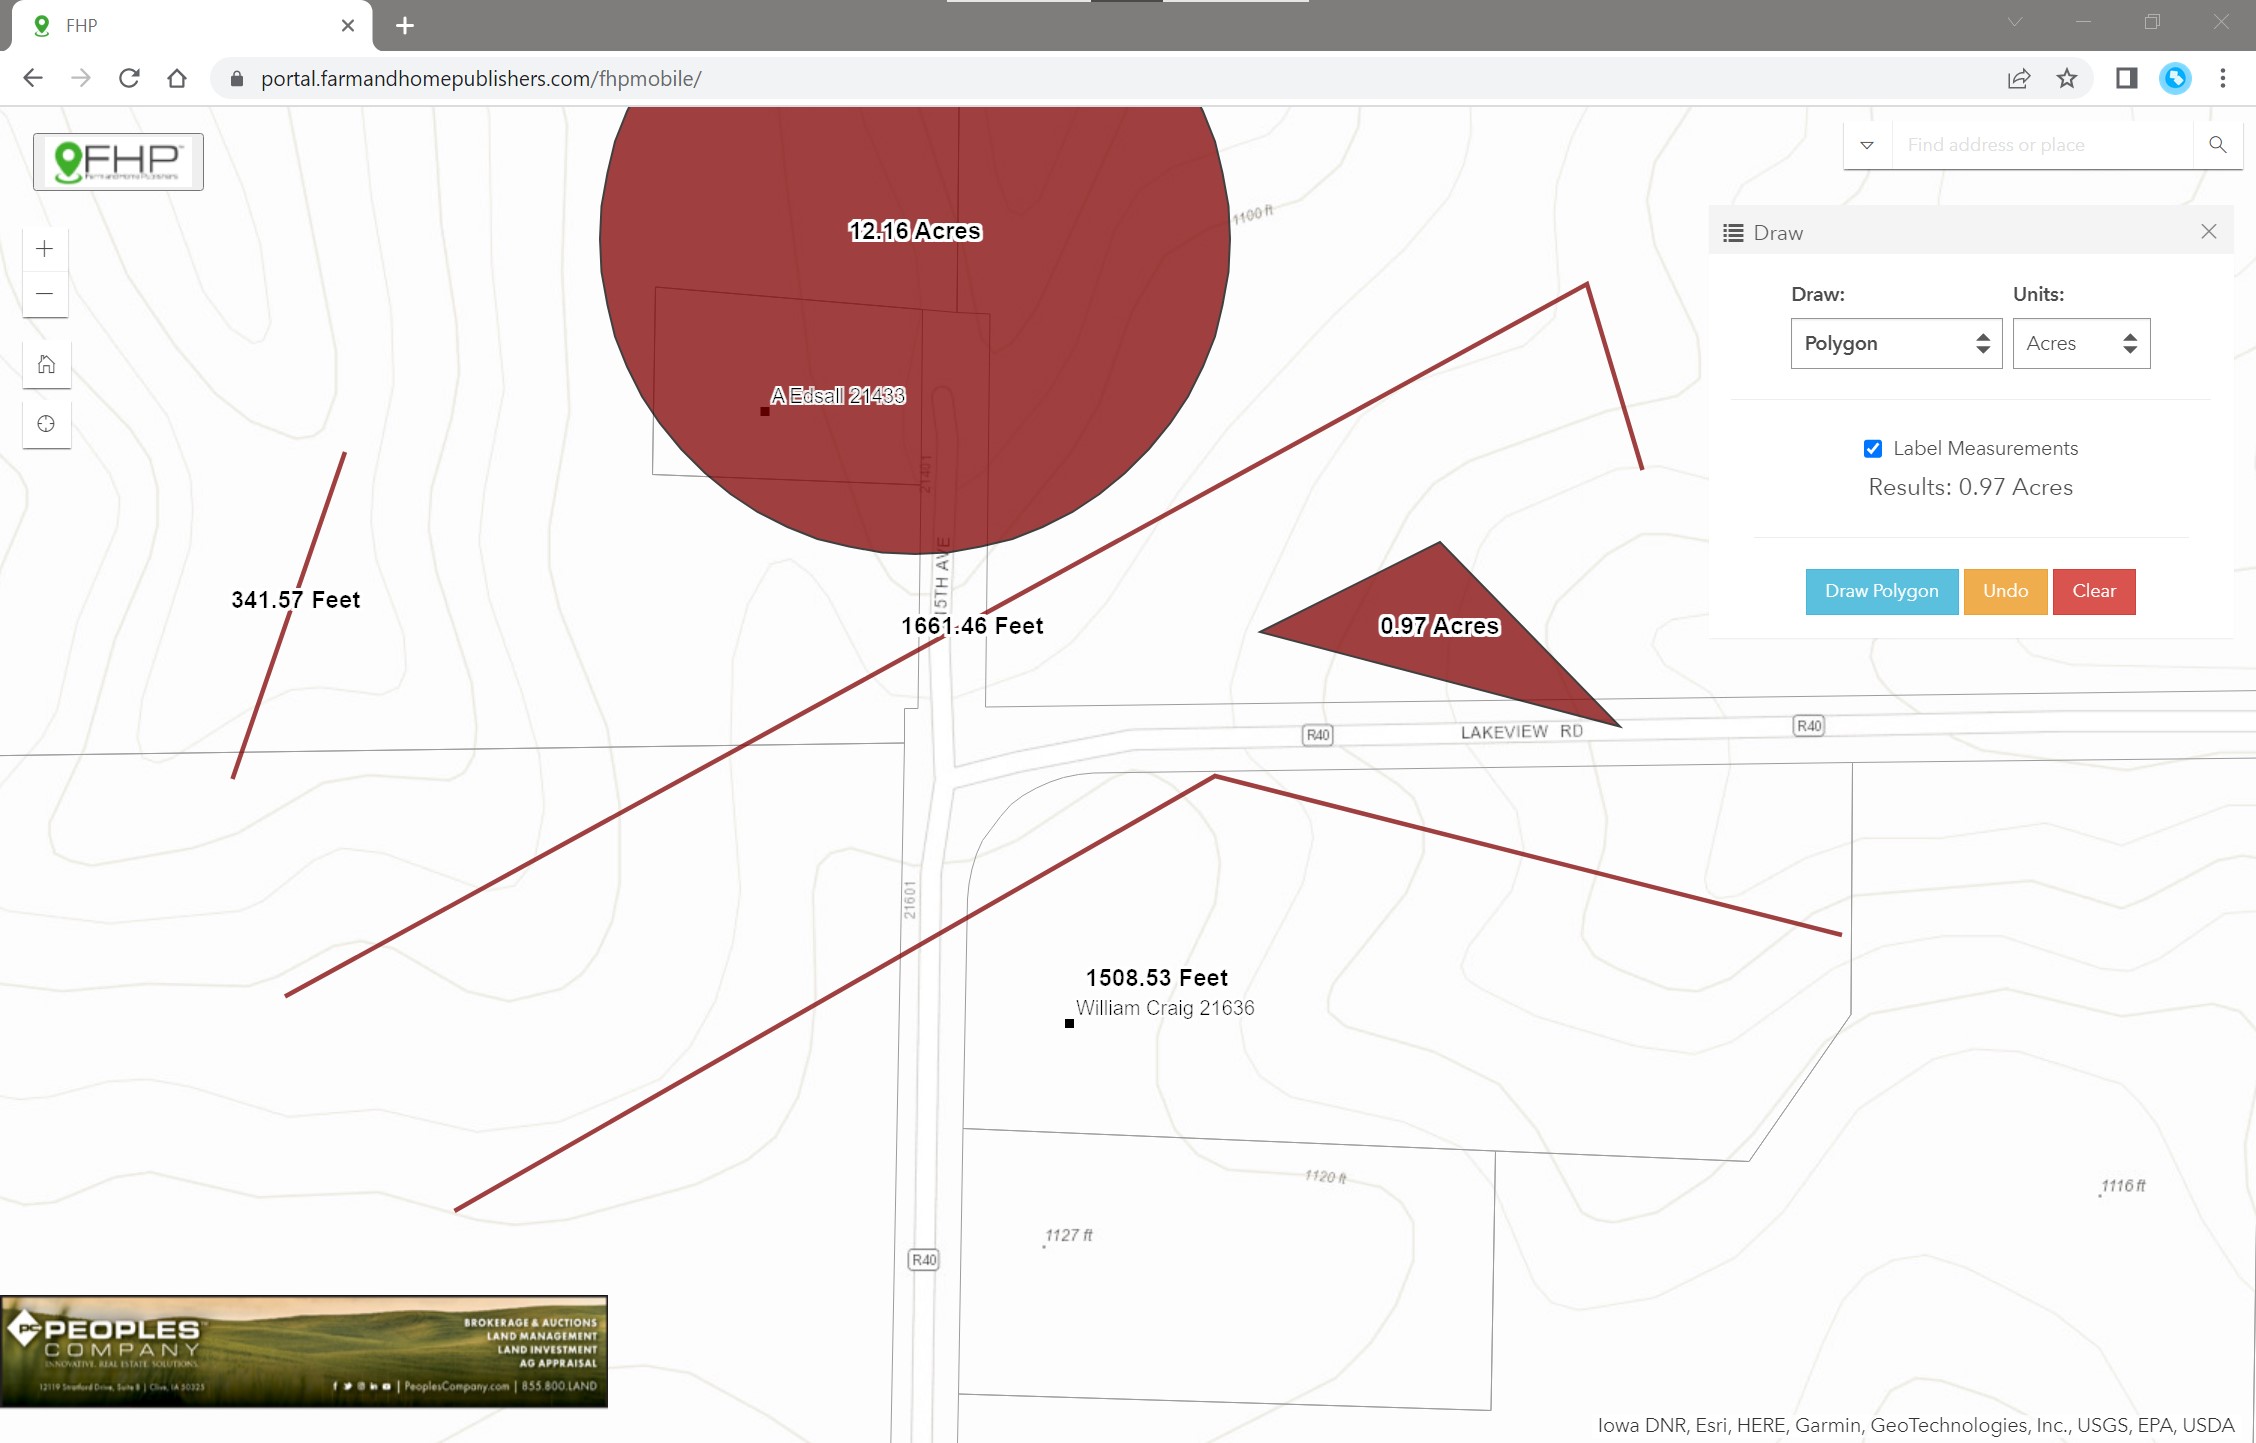
Using the Draw tool:
1) Like the Measure tool, choose a type from "Draw" and unit of measure from "Units"
2) Optionally, choose to "Label Measurements".
3) You must click the blue "Draw" button to activate the tool, then begin interacting on the map.
4) Most options you must double-click to finish the drawing.
- Undo: undoes the last action.
- Clear: clears all markups from the map.
Additional Layers
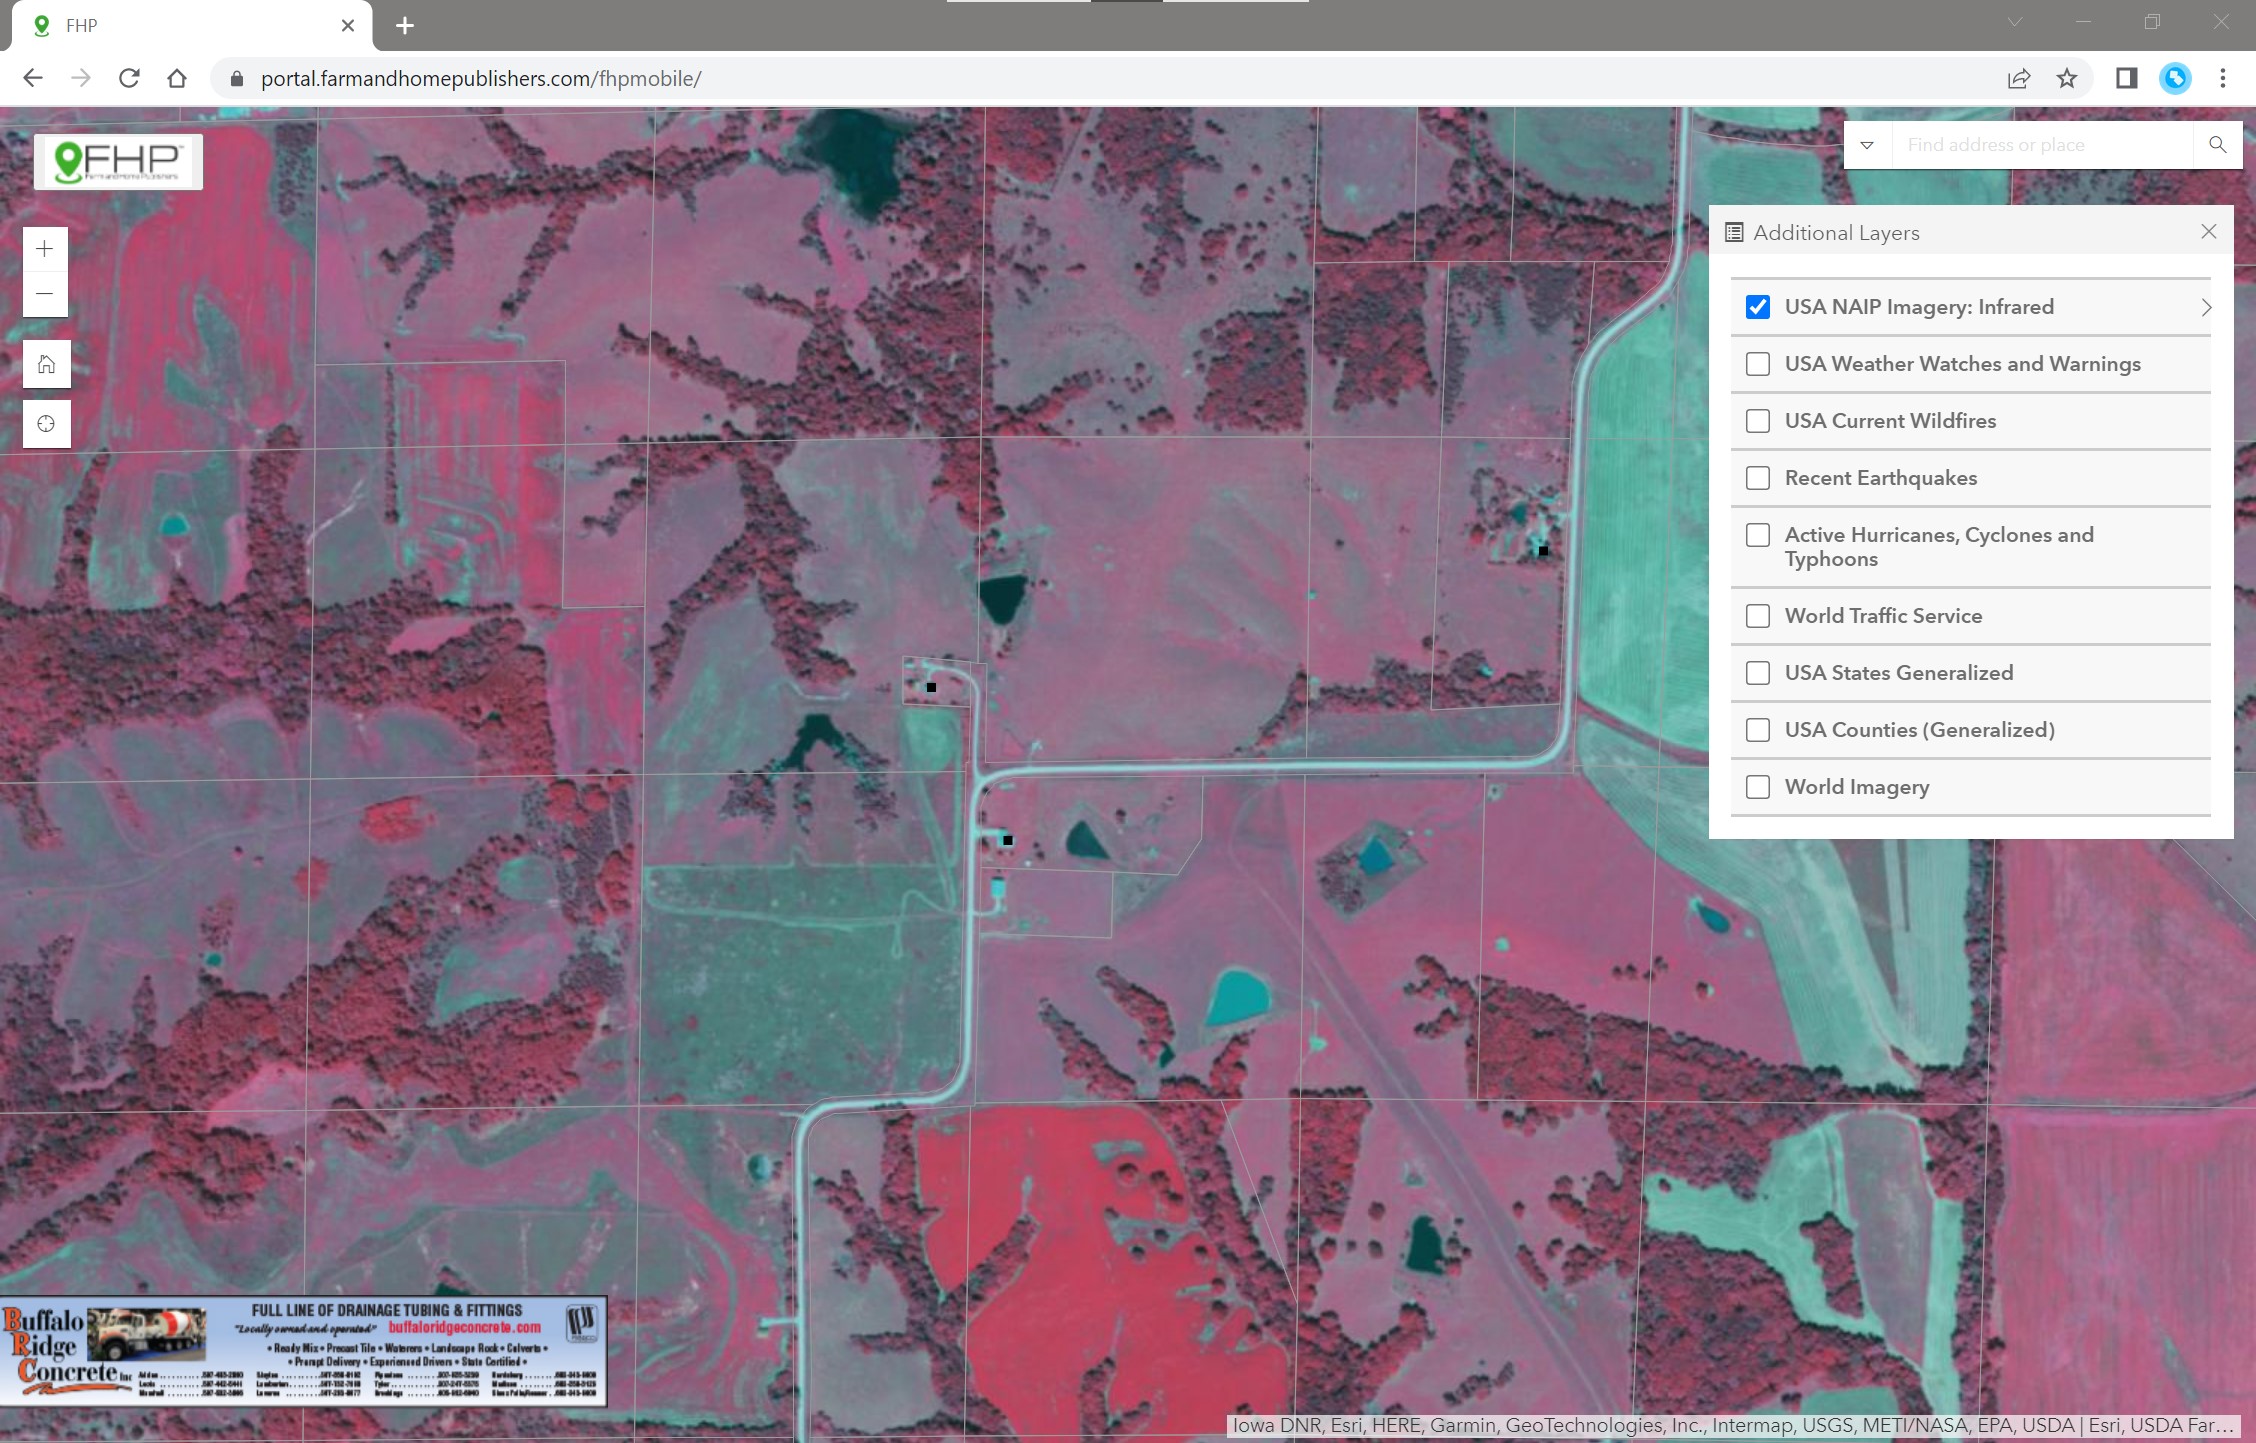
In addition to the hosted layers from the "Layer List" tool, there are also more listed in the "Additional Layers" tool. These layers are maintained and hosted through Esri, but provided because of their rich content for the end user. Some of the more notable ones include:
- USDA's National Agriculture Imagery Program (NAIP) Imagery. This is 1-meter, annually refreshed satellite imagery hosted in (a) natural color and (b) color-infrared.
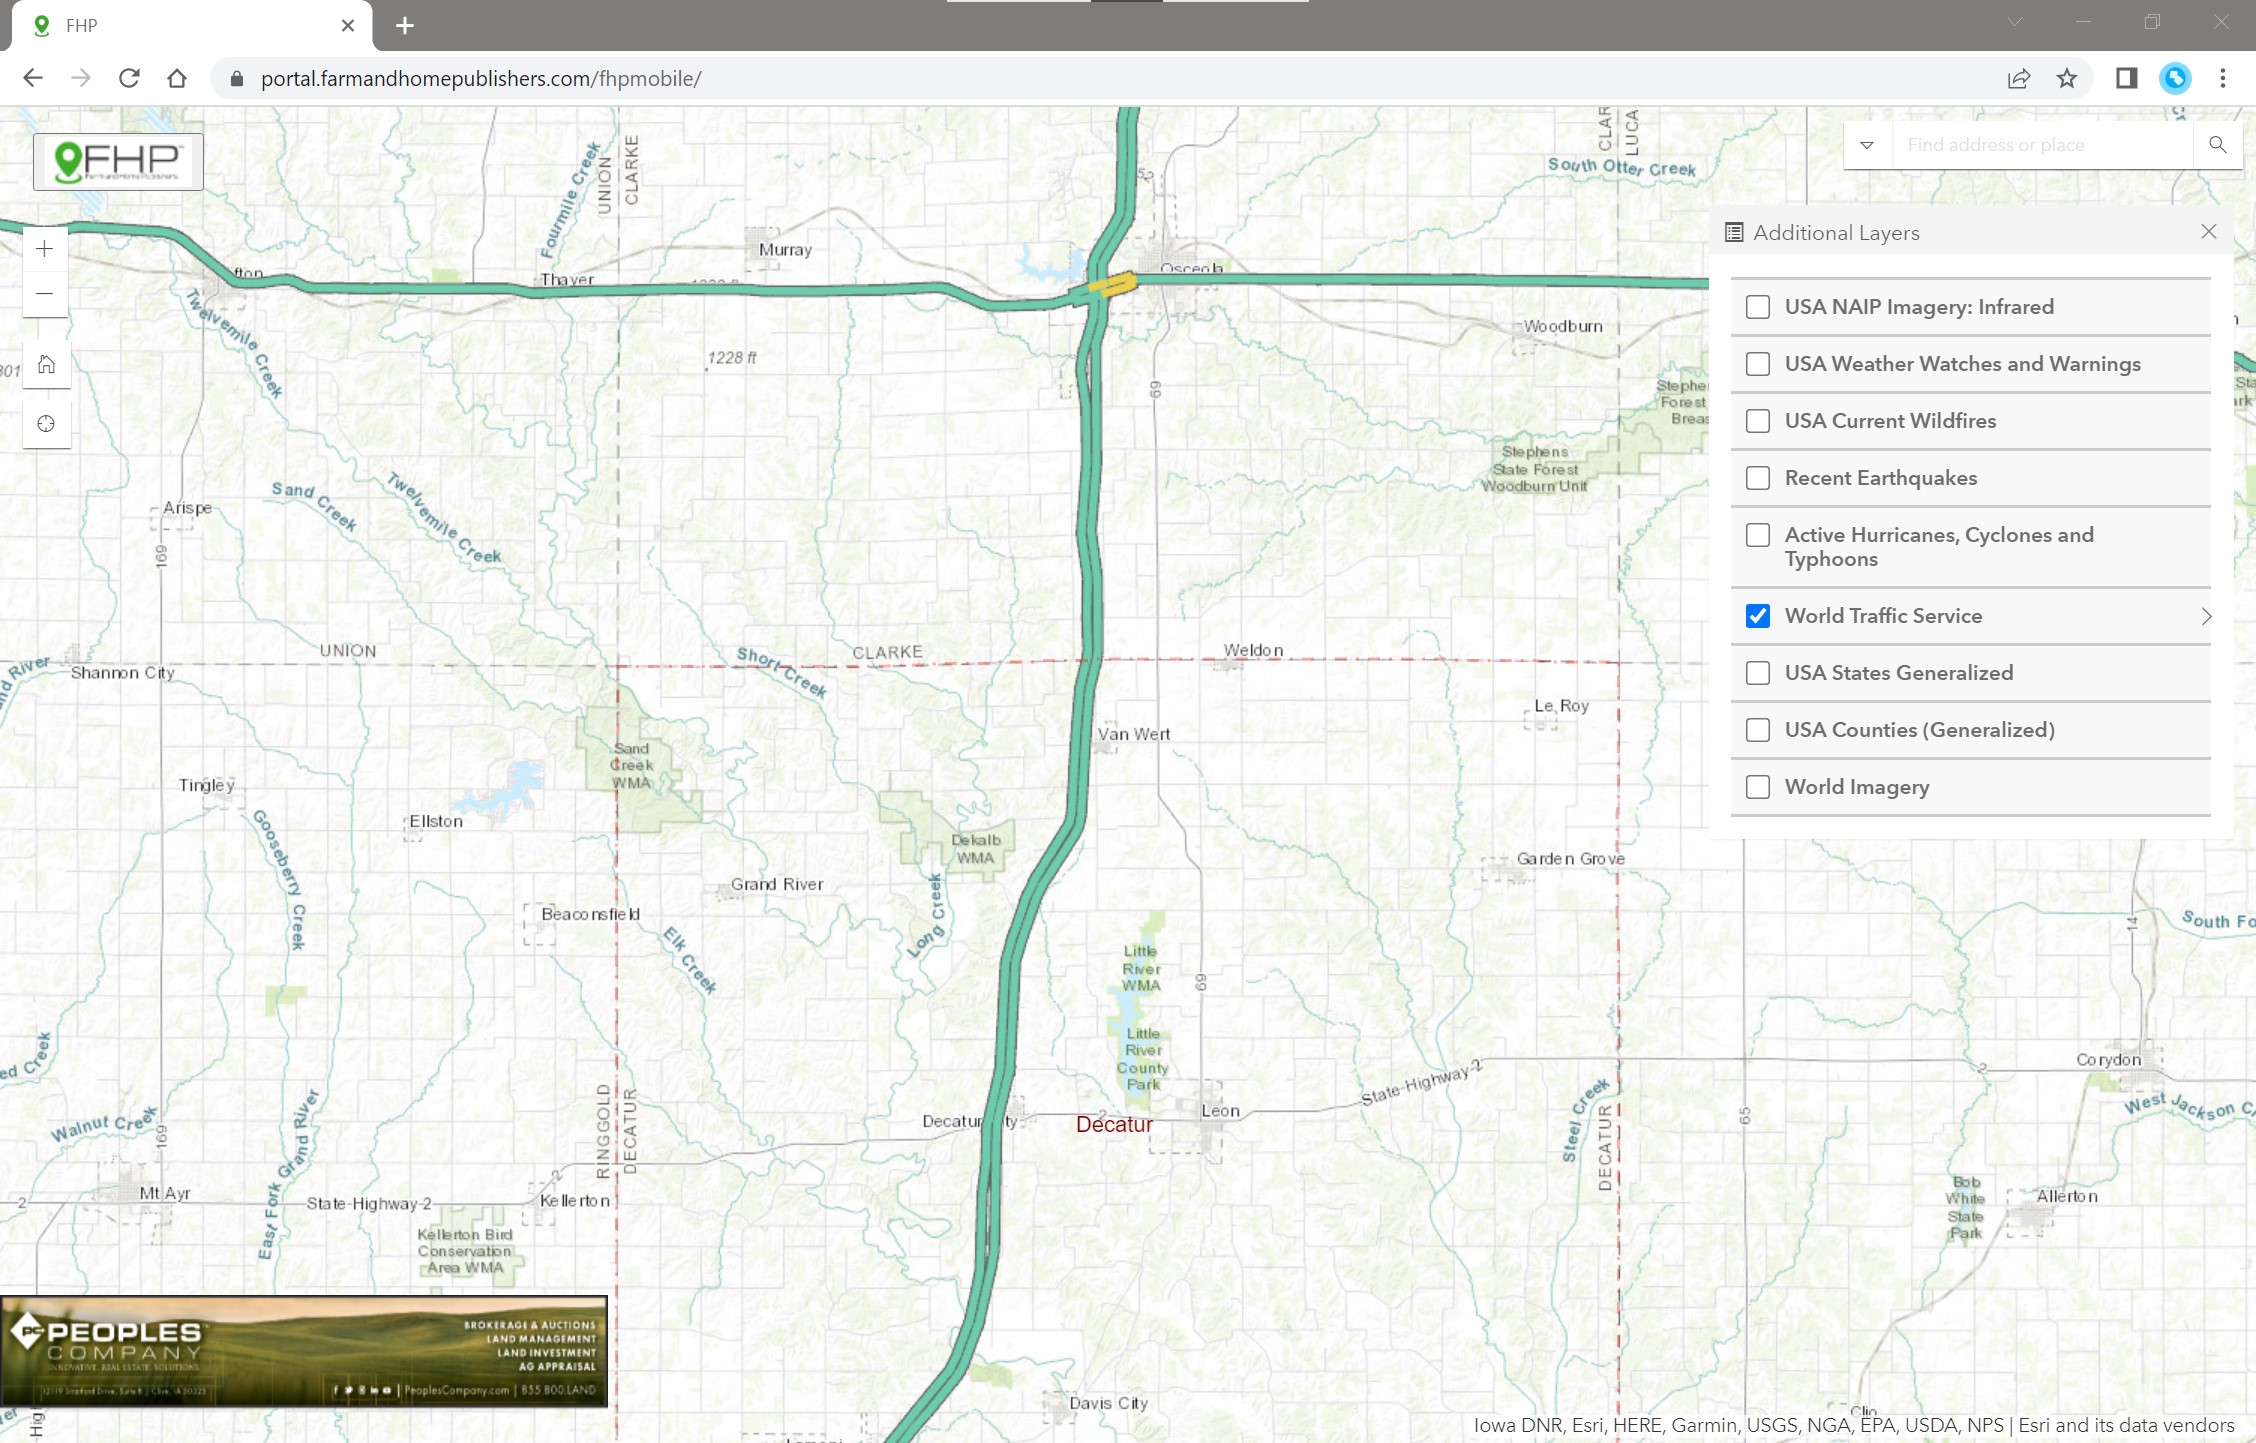
- Live World Traffic Service (shown below). Linear data of roads showing symbology with the following designation:
- Green (fast) 85-100% of free flow speeds
- Yellow (moderate) 65-85%
- Orange (slow) 45-65%
- Red (stop and go) 0-45%
- Weather events (several different services
- Administrative boundaries
- And more
Bookmarks
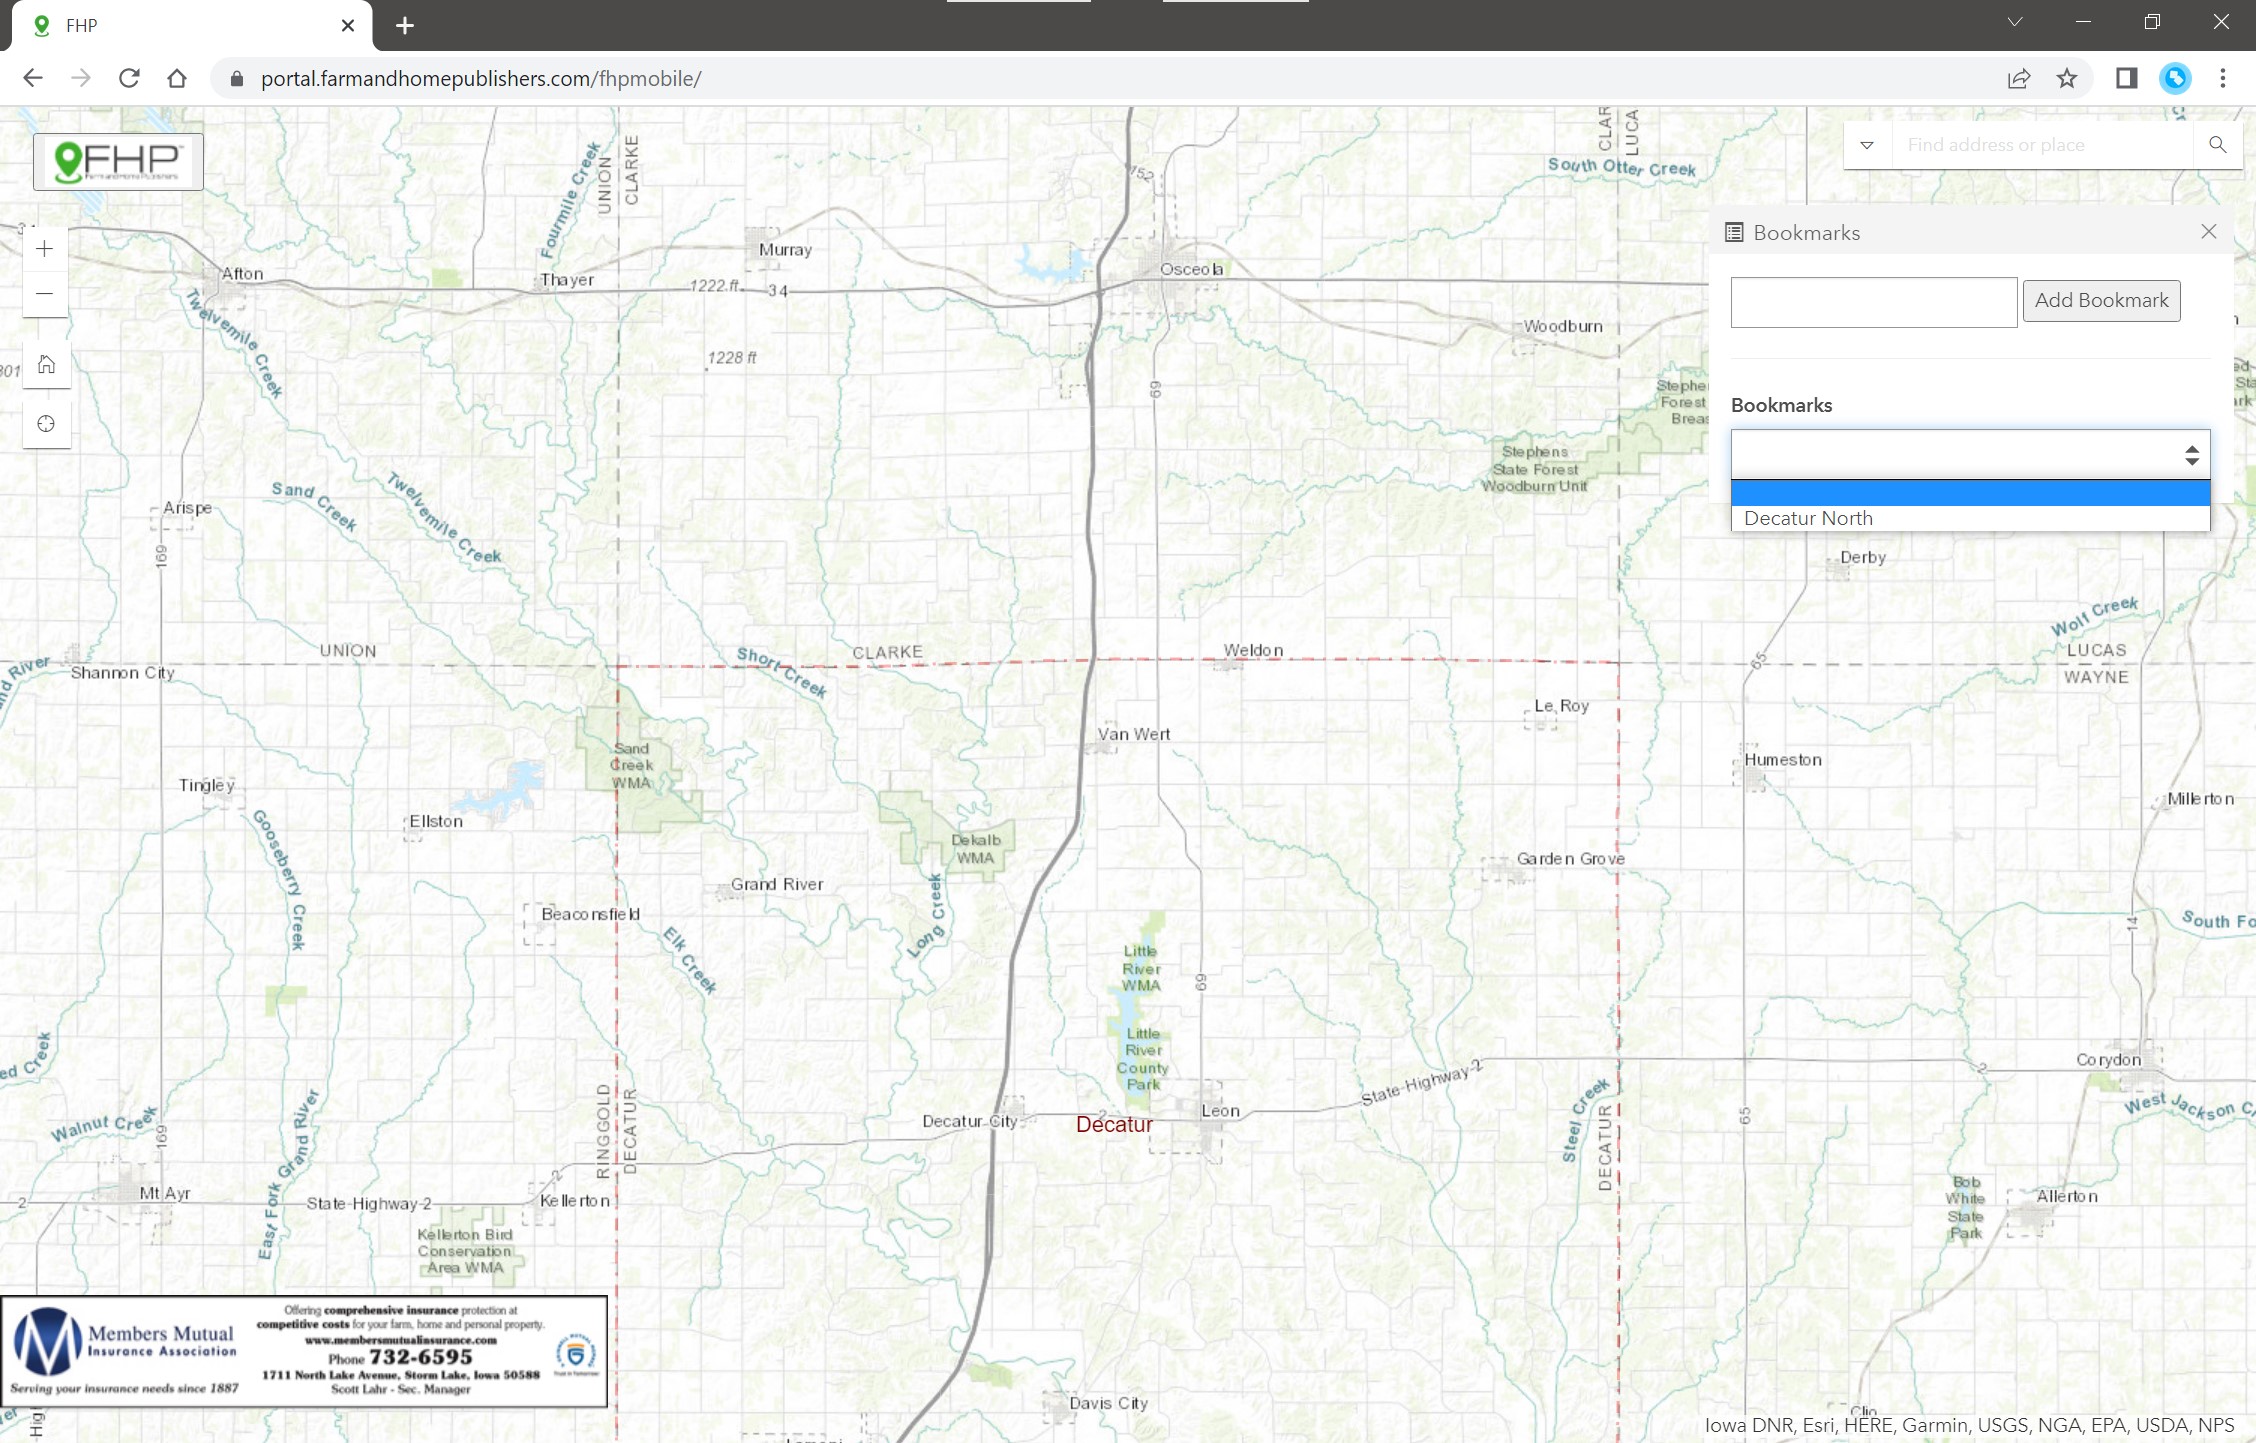
Bookmarks are stored locations that a user can return to during their session. To create a new Bookmark simply (a) type a name for the bookmark and (b) click "Add Bookmark." That will add the XY location and Zoom scale to a list in the dropdown under "Bookmarks."
To return to the store location, click the dropdown and select the bookmark. This will zoom the user back to the prior set location.
In this image, there is already a bookmark added called "Decatur North" in the Bookmarks dropdown, where all previously saved bookmarks will be located.
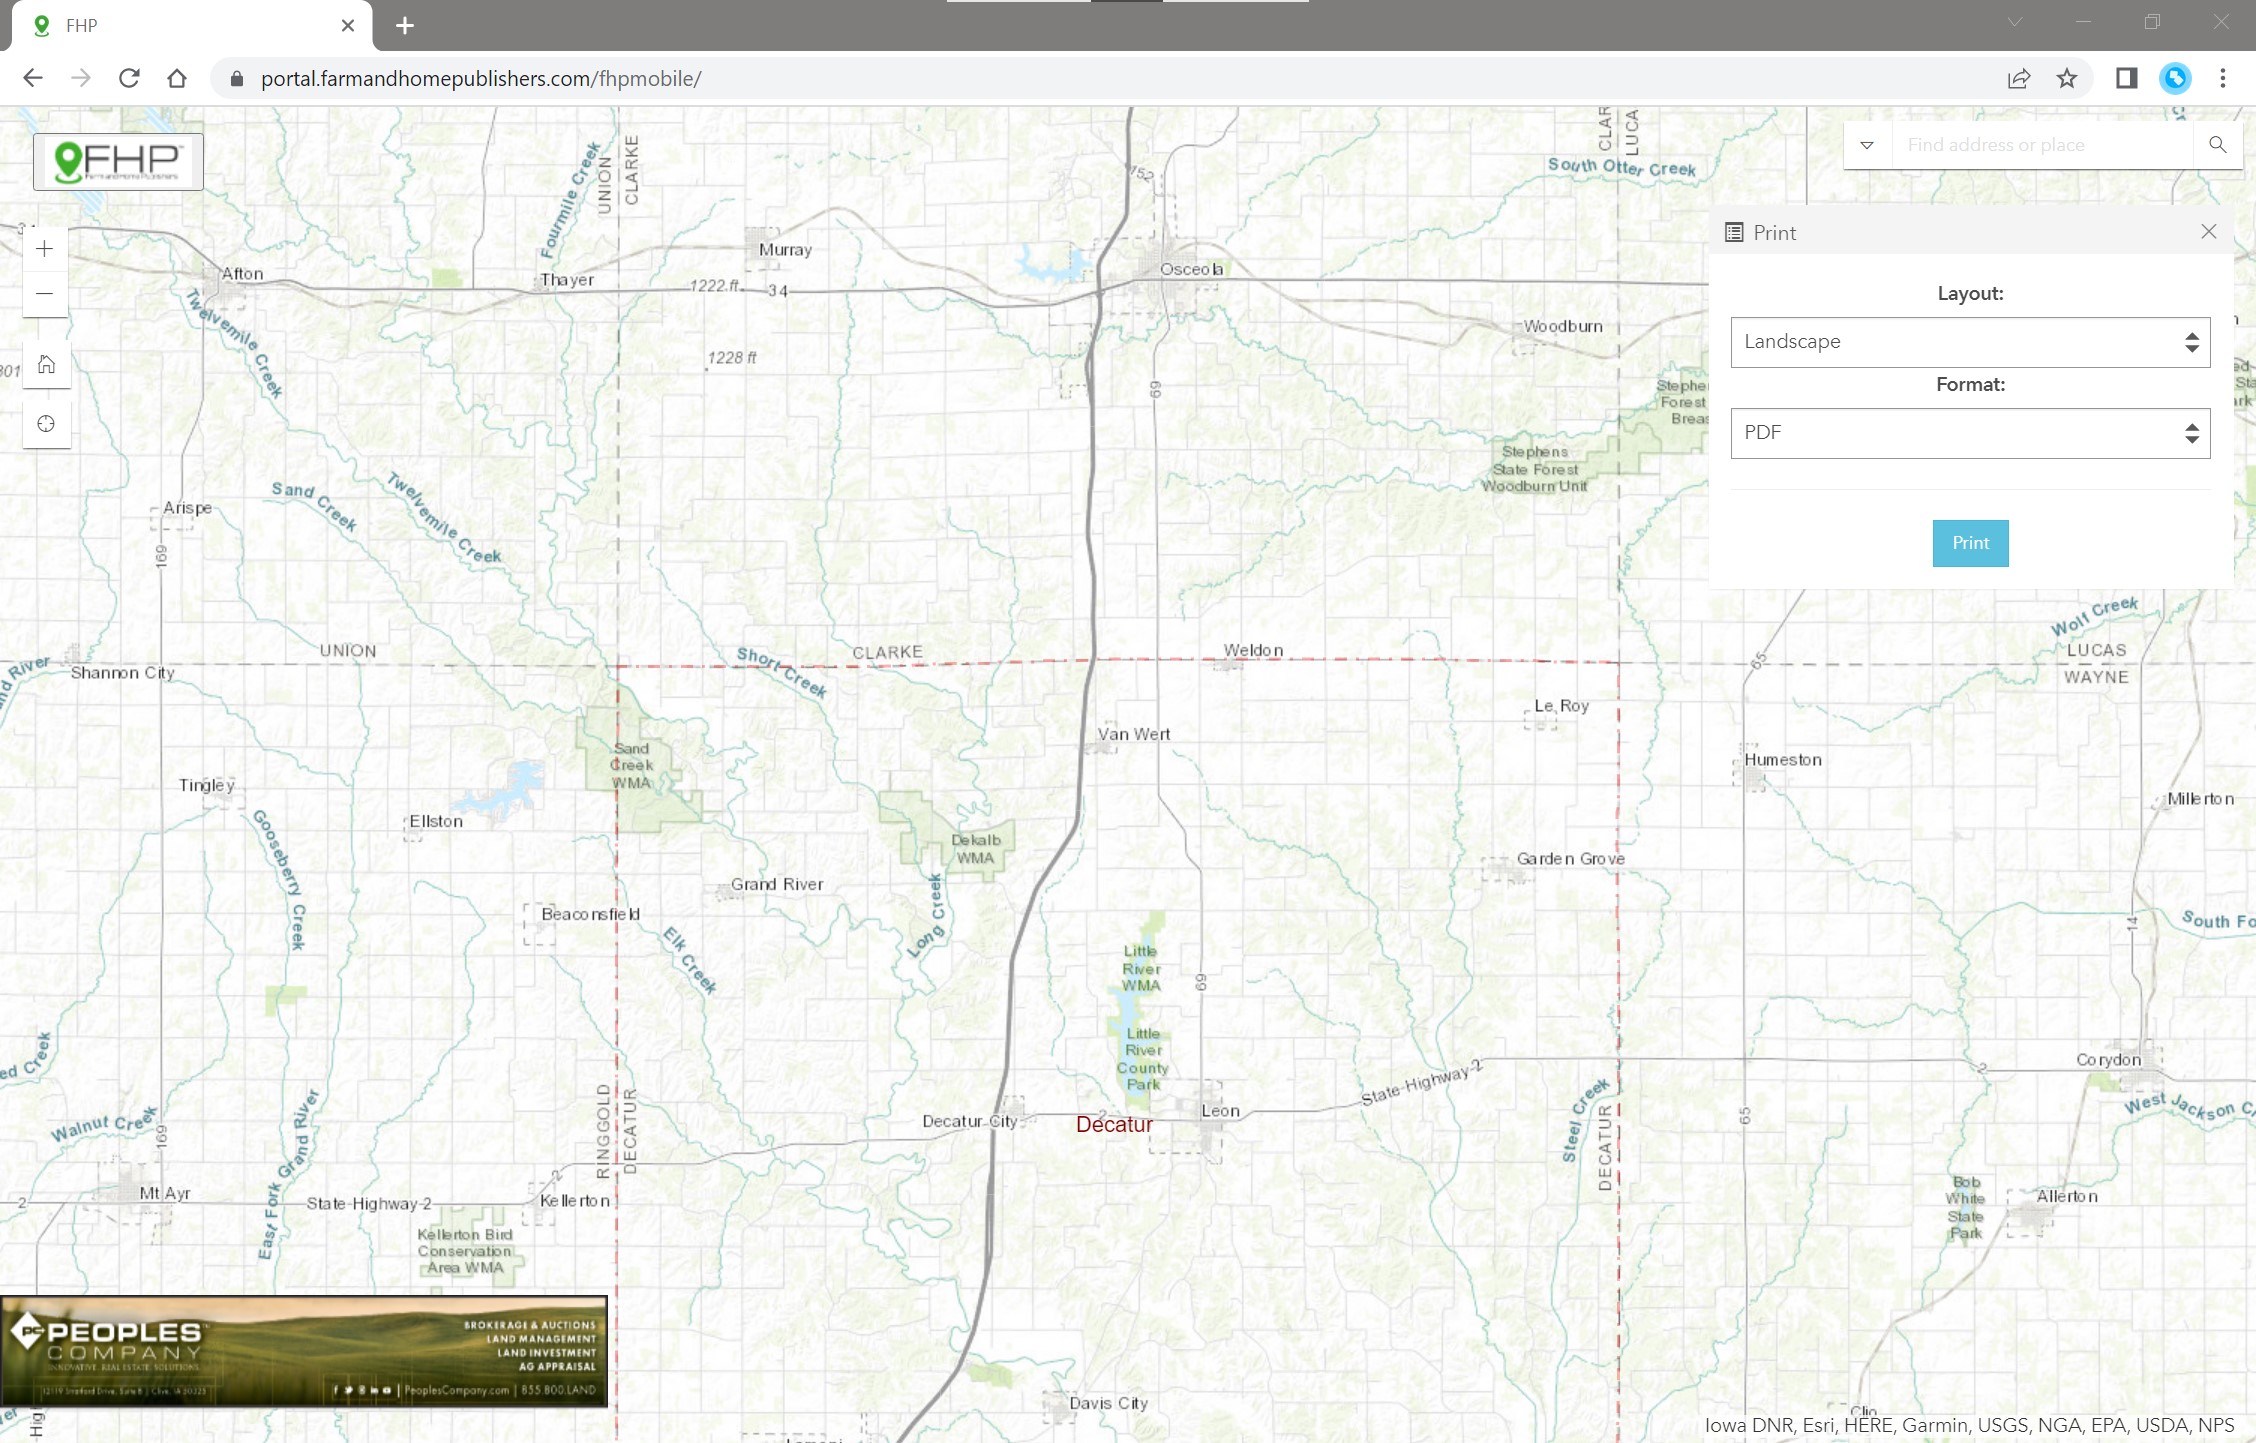
The Print tool allows the user to export any map view printing in JPEG and PDF formats, either in a Portrait map view, Landscape map view, or Screenshot (fullscreen view). To use the tool, choose the desired options, and click the "Print" button to initiate the export.
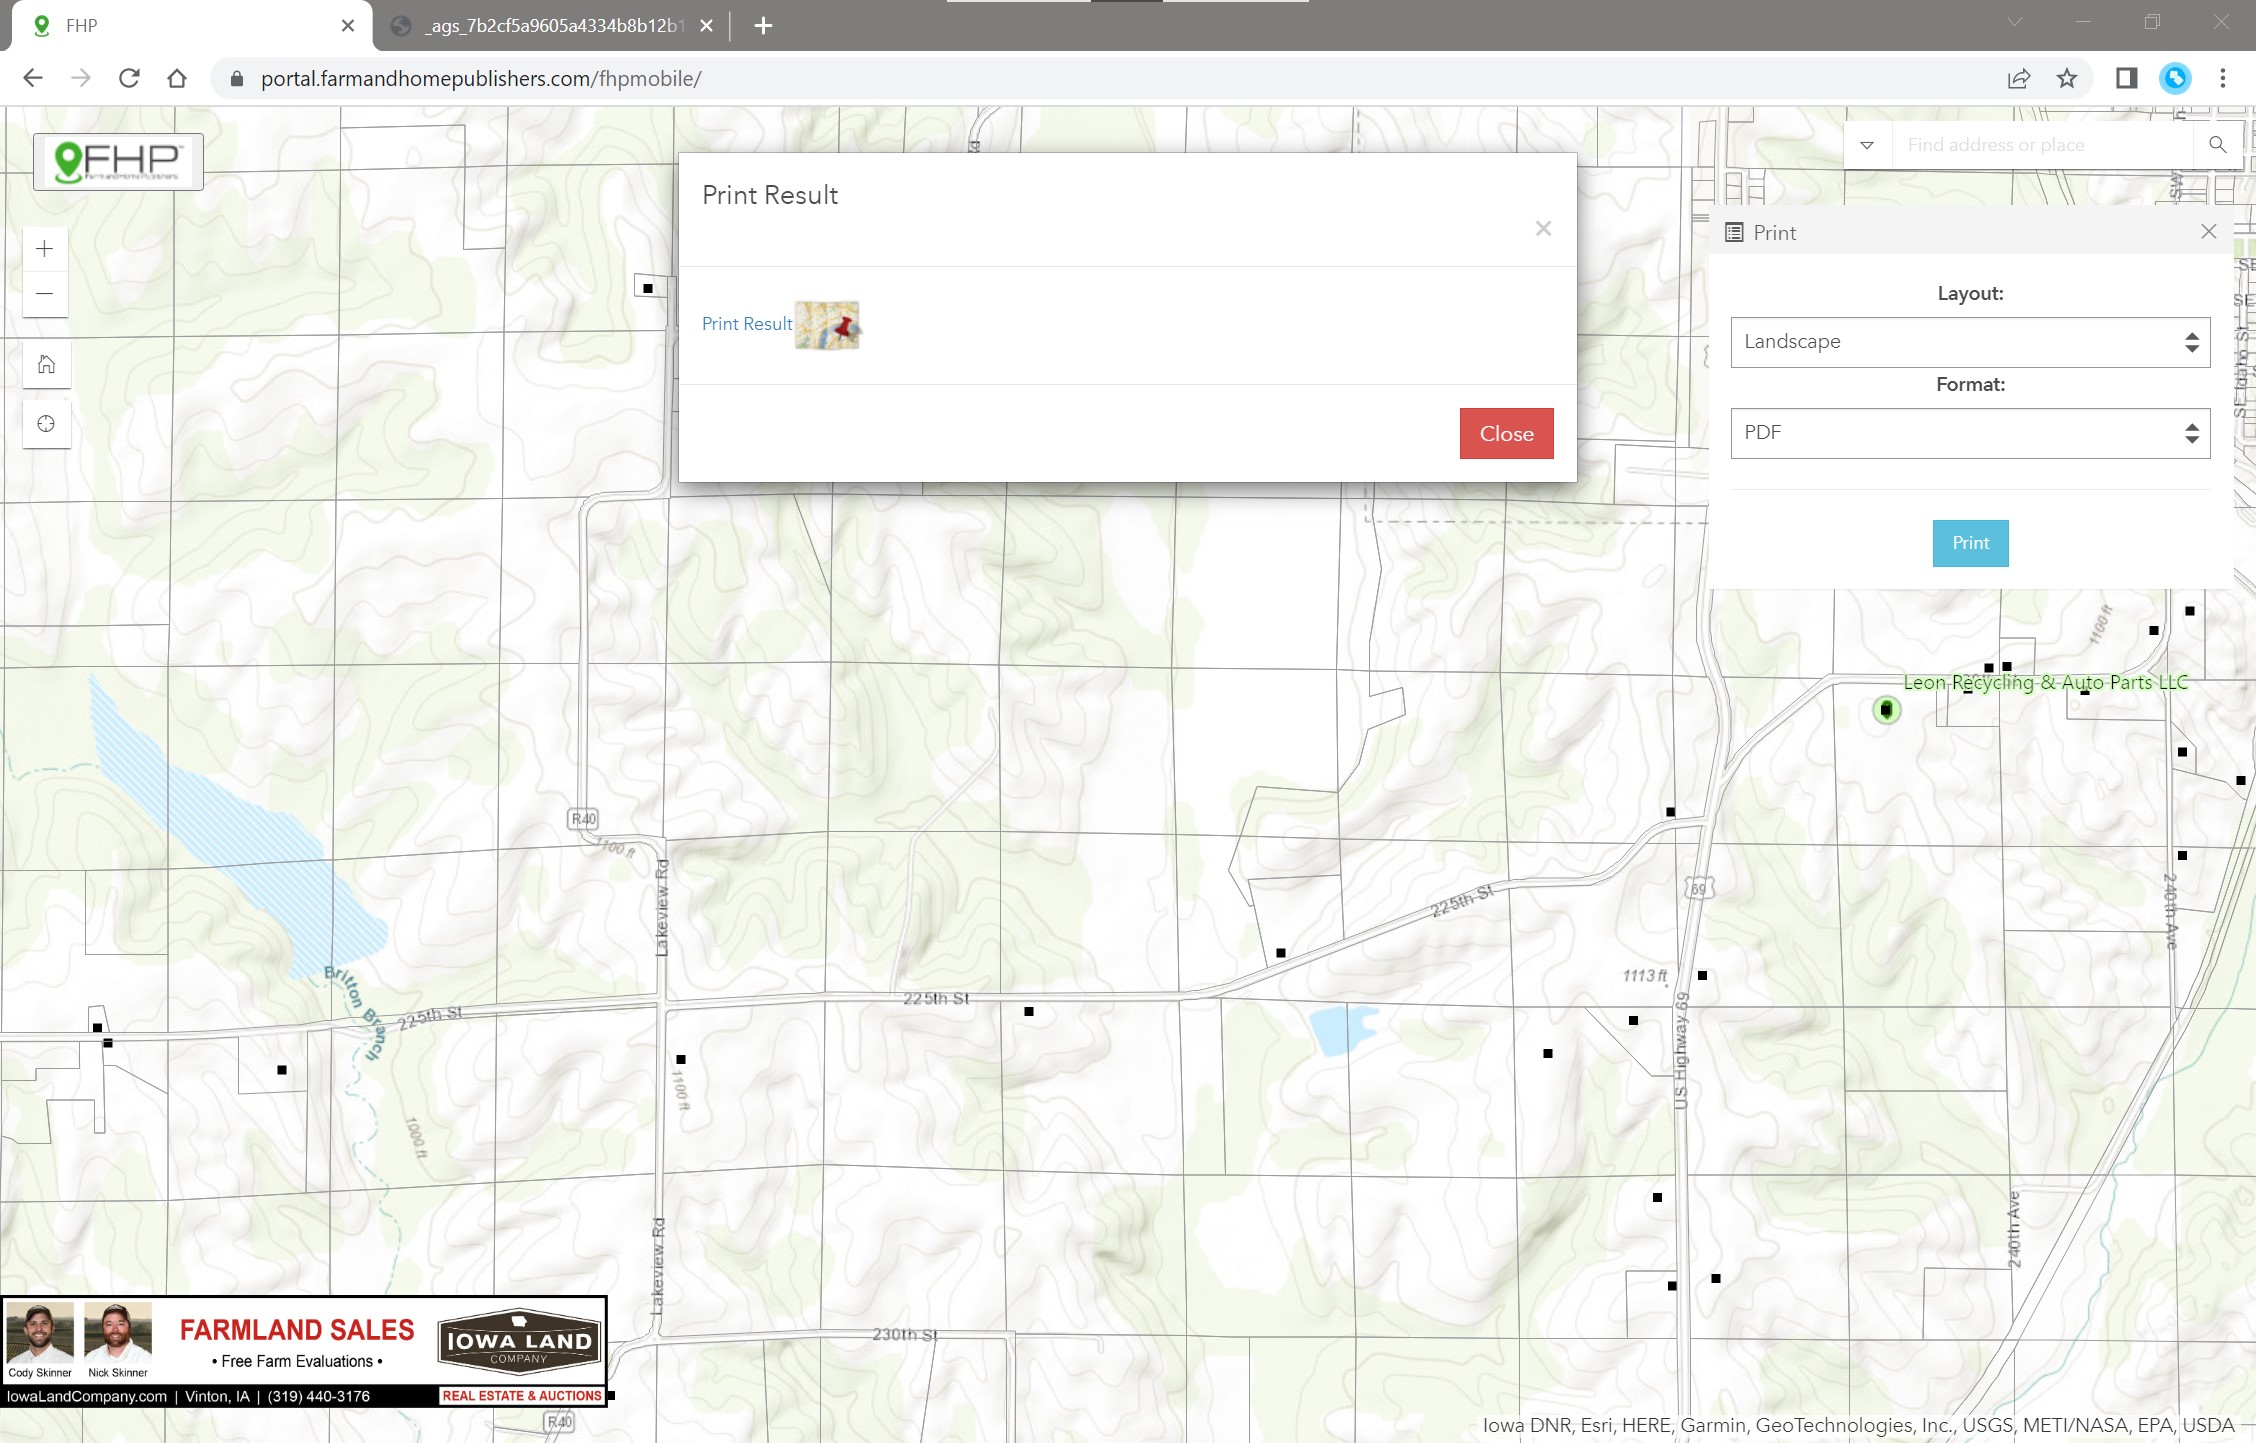
Once the export has finished, it will show up in the pop-up window for downloading. Click on the "Print Result" to download the file.